Copyright
©The Author(s) 2018.
World J Gastroenterol. Nov 21, 2018; 24(43): 4893-4905
Published online Nov 21, 2018. doi: 10.3748/wjg.v24.i43.4893
Published online Nov 21, 2018. doi: 10.3748/wjg.v24.i43.4893
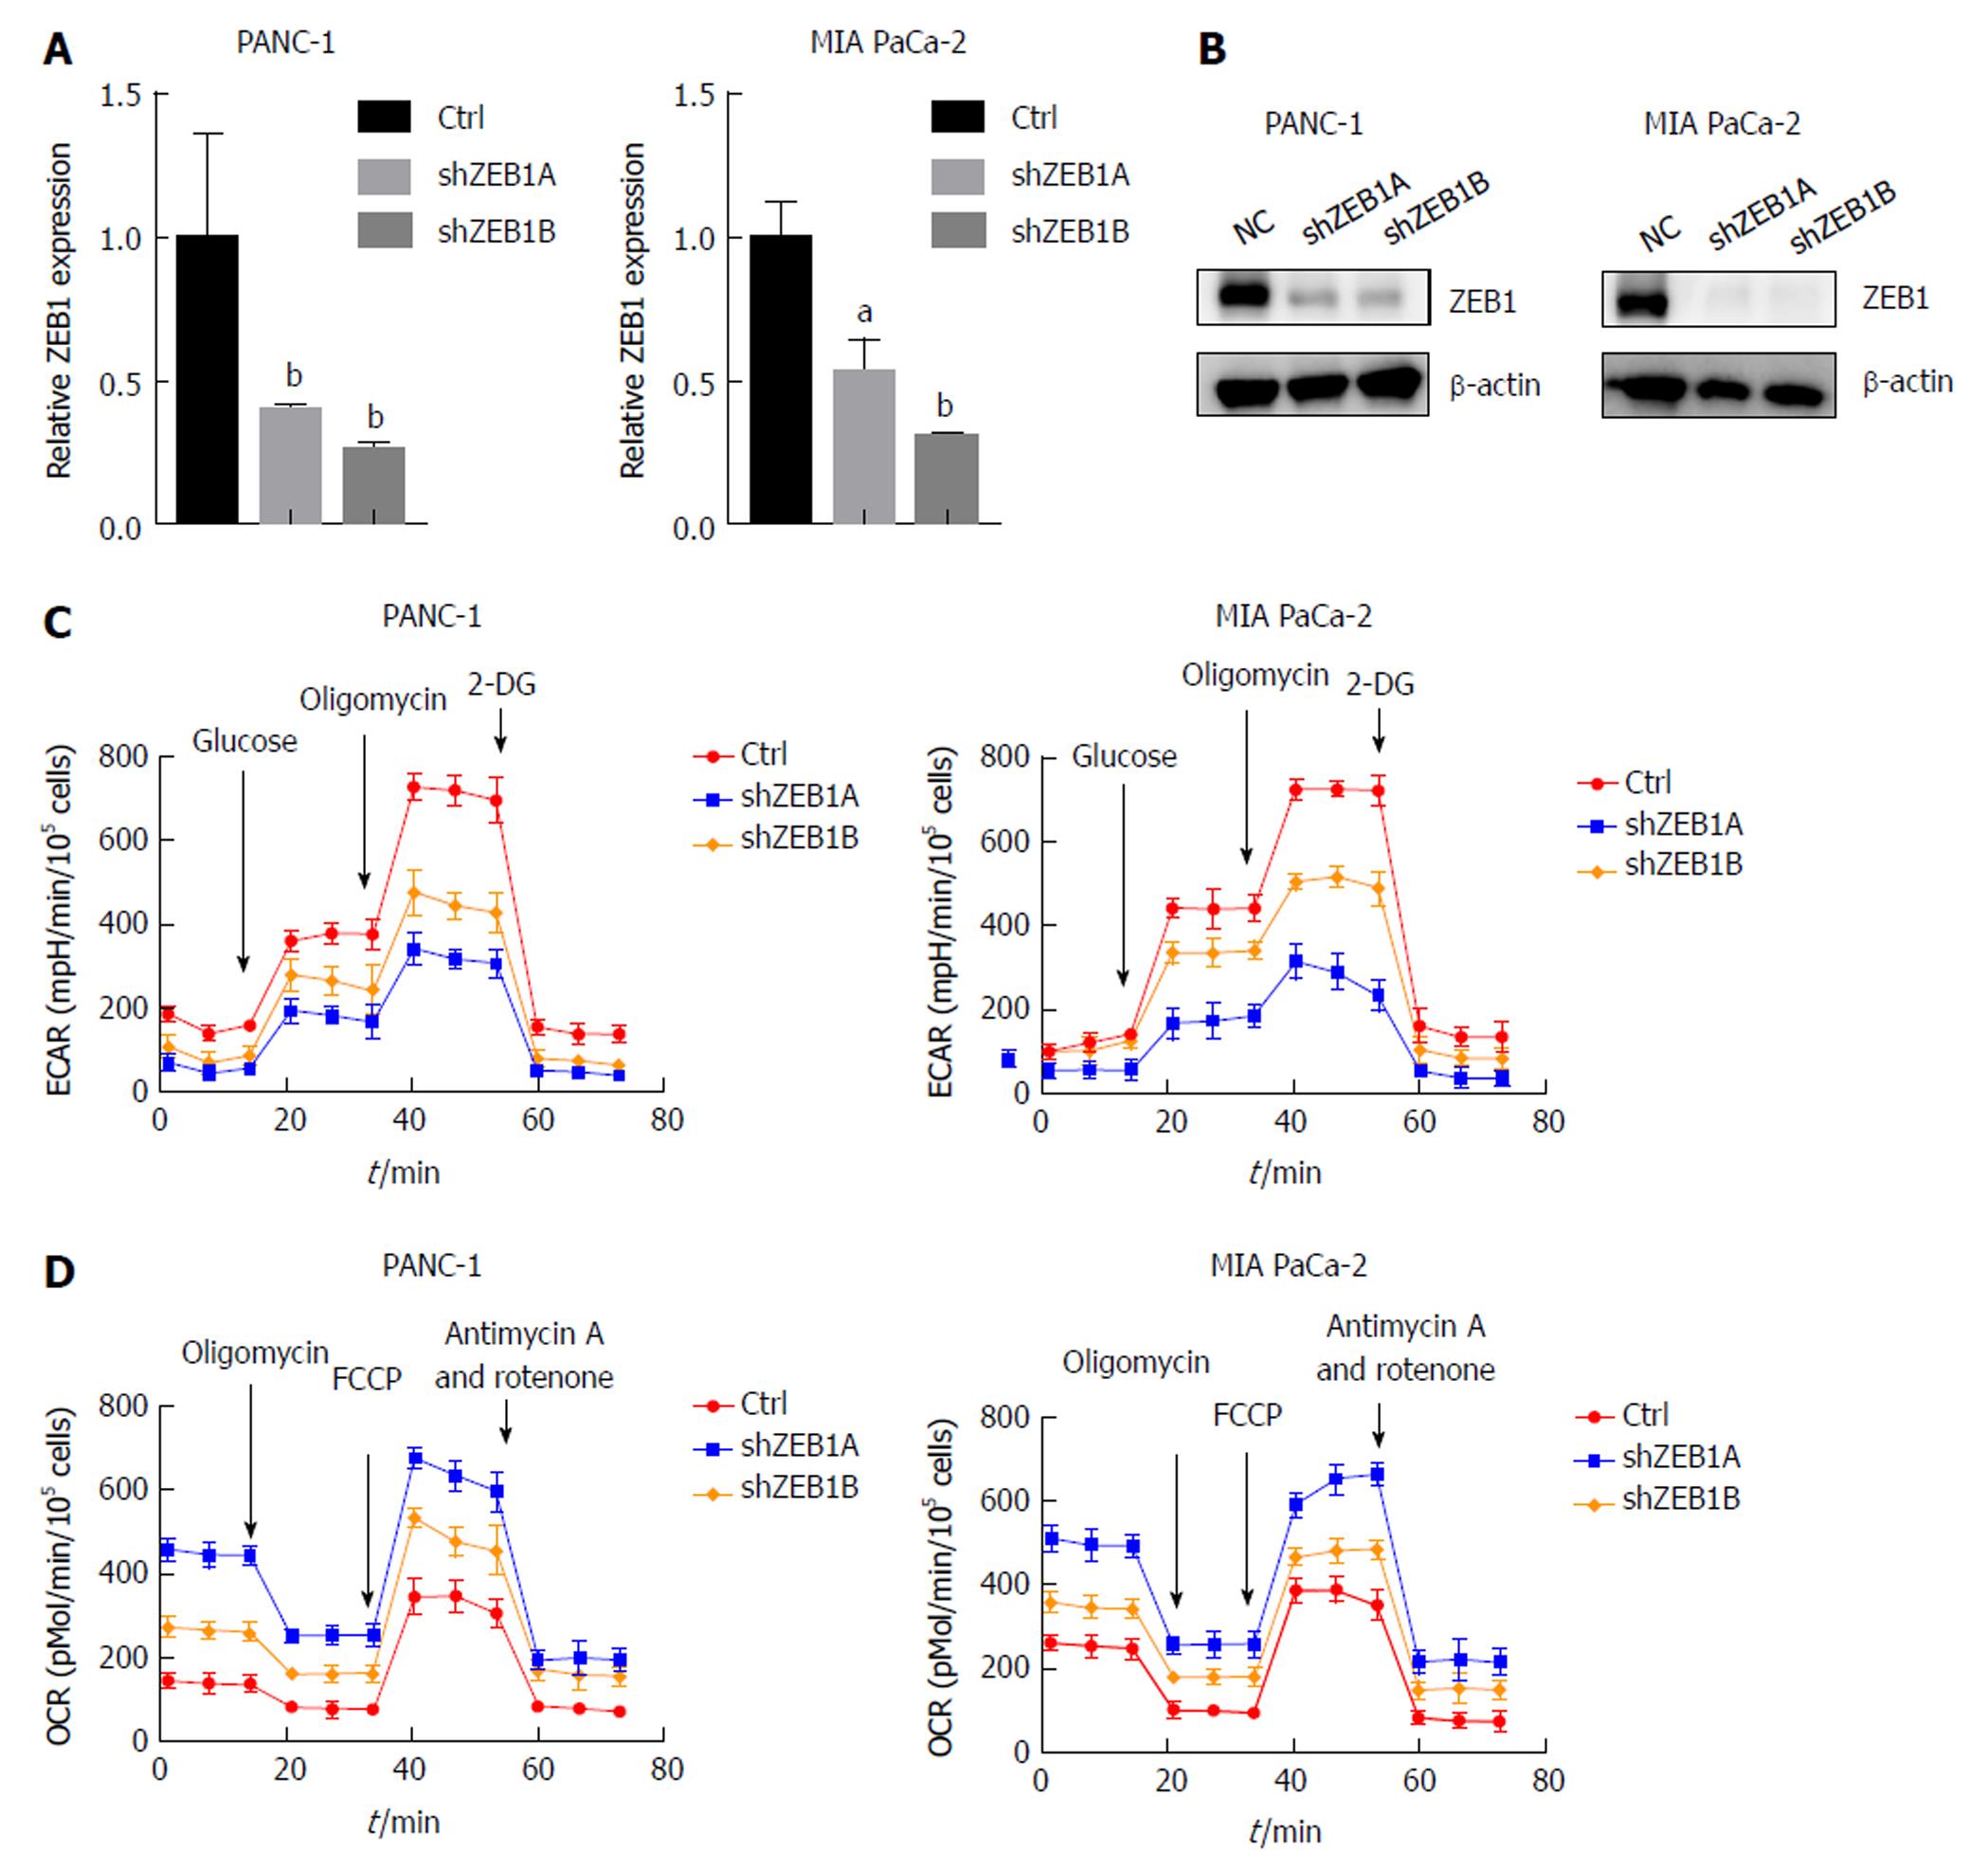
Figure 1 Zinc finger E-box binding homeobox-1 mediates aerobic glycolysis in pancreatic cancer.
A: Zinc finger E-box binding homeobox-1 (ZEB1) knockdown efficiency was assessed by quantitative real-time polymerase chain reaction in PANC-1 and MIA PaCa-2 cells; B: Immunoblot with ZEB1 antibody confirmed that ZEB1 was effectively downregulated in PANC-1 and MIA PaCa-2 cells; C: ZEB1 knockdown decreased glycolysis, as reflected by extracellular acidification rate measurements; D: ZEB1 knockdown increased mitochondrial respiration, measured by oxygen consumption rate; E and F: Decreased ZEB1 expression in PANC-1 and MIA PaCa-2 cells decreased reactive oxygen species generation; G and H: Downregulation of ZEB1 increased mitochondrial membrane potential in PANC-1 and MIA PaCa-2 cells. aP < 0.05, and bP < 0.01 vs NC or mock group. Error bars indicate mean ± SD. ZEB1: Zinc finger E-box binding homeobox-1; ECAR: Extracellular acidification rate; OCR: Oxygen consumption rate.
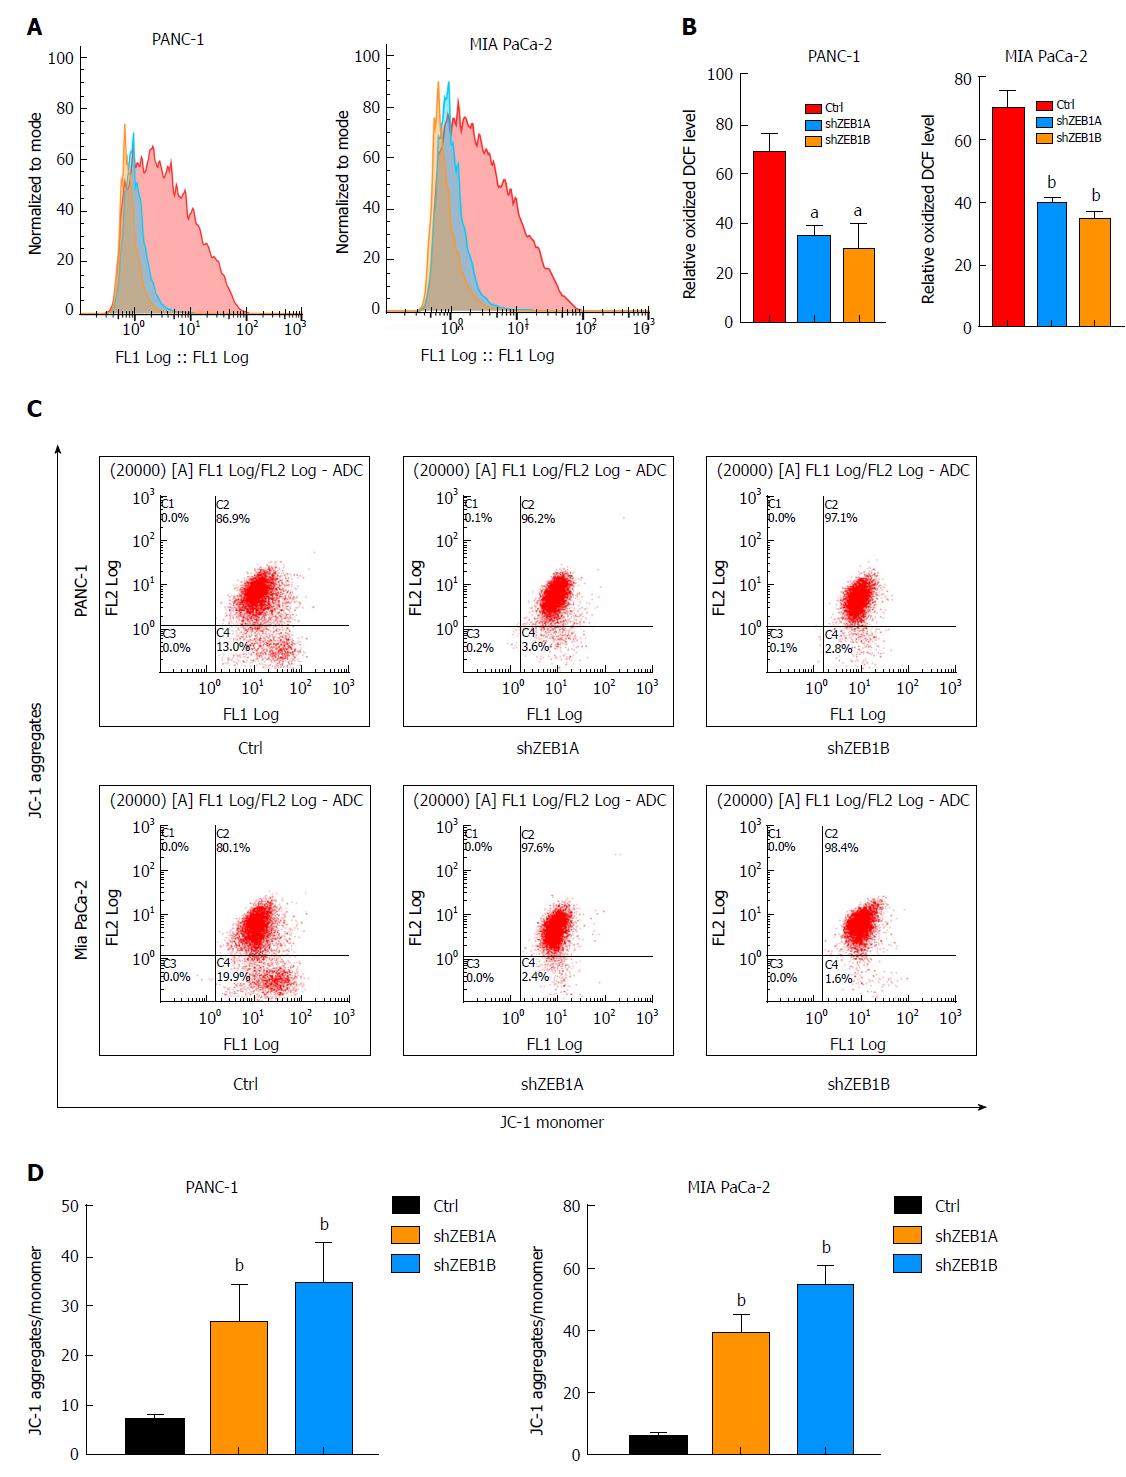
Figure 2 Zinc finger E-box binding homeobox-1 regulates reactive oxygen species generation and mitochondrial membrane potentials.
A and B: Decreased zinc finger E-box binding homeobox-1 (ZEB1) expression in PANC-1 and MIA PaCa-2 cells decreased reactive oxygen species generation, as demonstrated by using ROS assay kit analysis; C and D: Downregulation of ZEB1 increased mitochondrial membrane potential in PANC-1 and MIA PaCa-2 cells, which were confirmed by membrane potential probe JC-1 measurements. aP < 0.05, and bP < 0.01 vs NC or mock group. Error bars indicate mean ± SD. ROS: Reactive oxygen species; ZEB1: Zinc finger E-box binding homeobox-1.
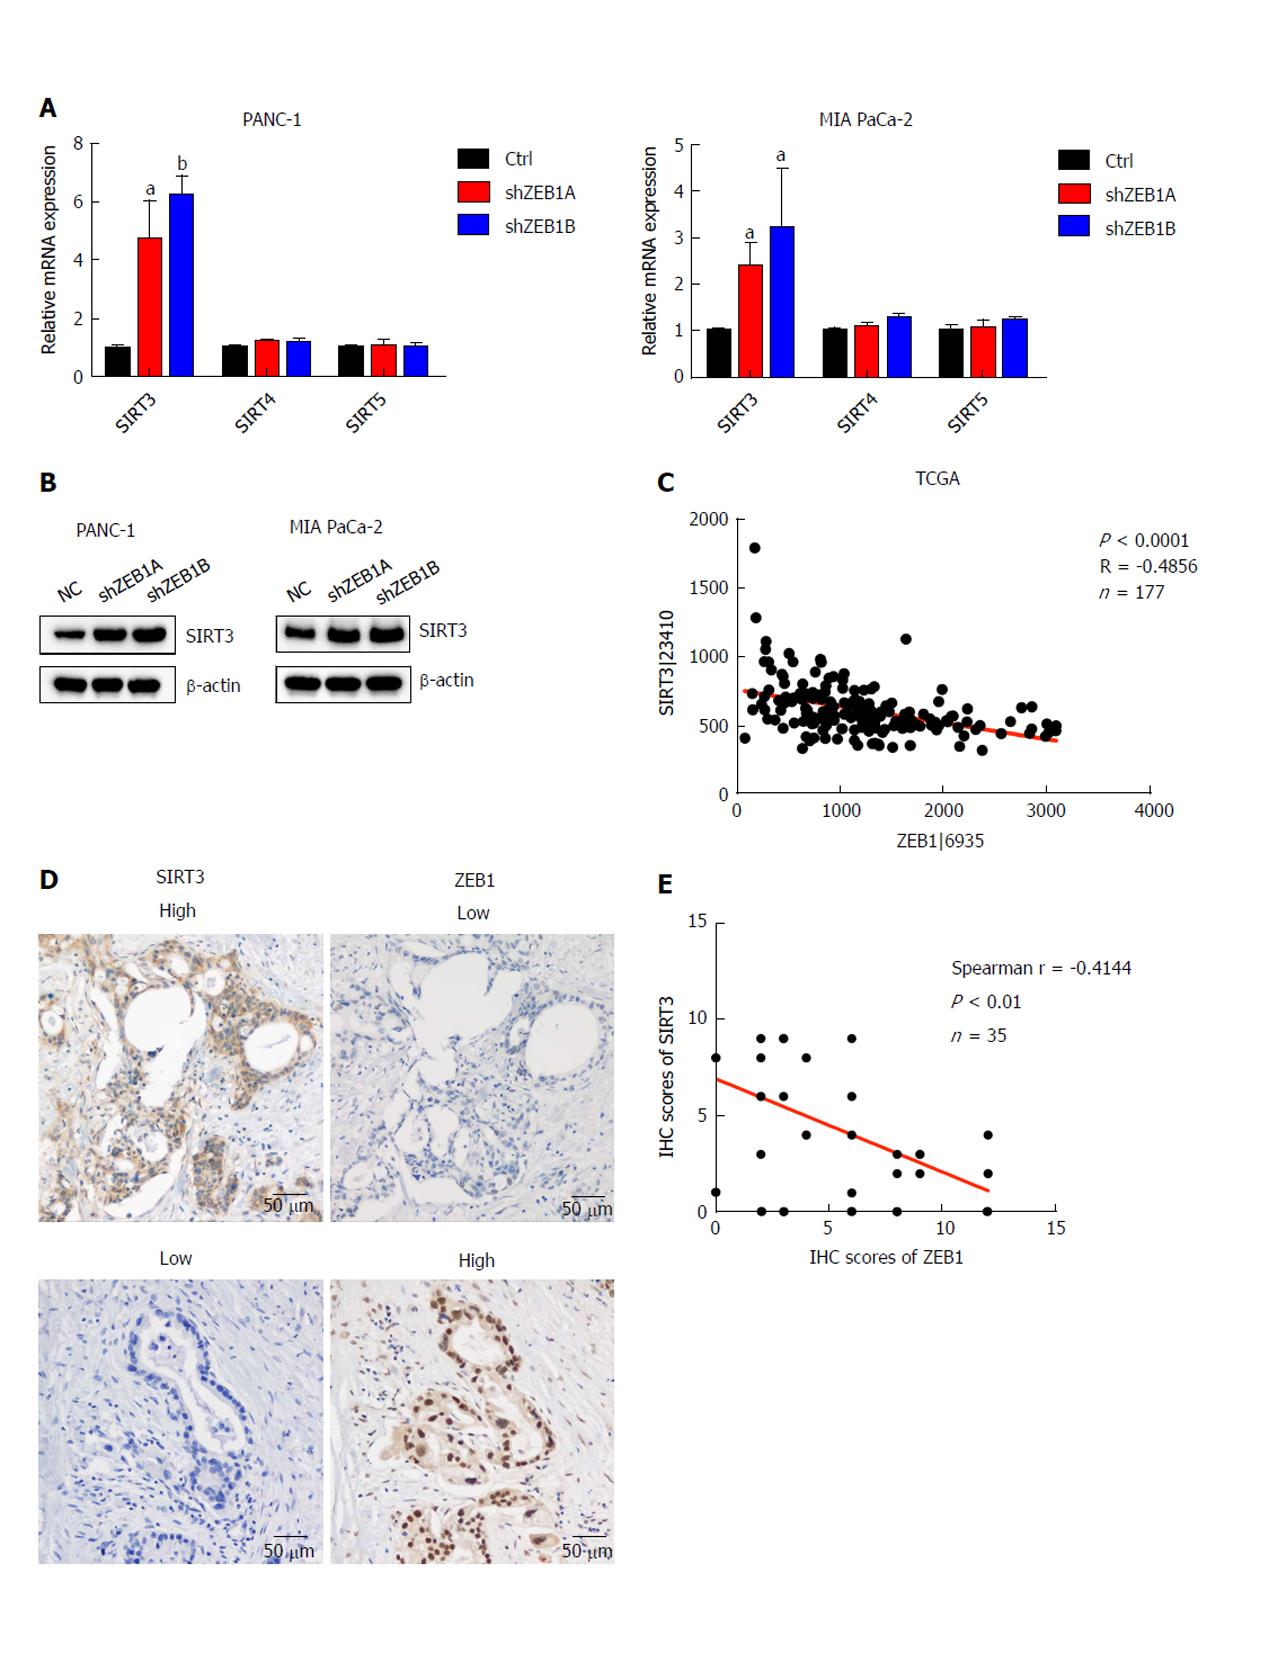
Figure 3 Zinc finger E-box binding homeobox-1 expression is negatively correlated with sirtuin 3 expression in pancreatic cancer.
A: Zinc finger E-box binding homeobox-1 (ZEB1) knockdown increased sirtuin 3 (SIRT3) mRNA levels in PANC-1 and MIA PaCa-2 cells, but had only a small impact on SIRT4 and SIRT5 expression; B: SIRT3 protein levels increased in ZEB1-silenced PANC-1 and MIA PaCa-2 cells; C: SIRT3 expression negatively and significantly correlated with ZEB1 expression in The Cancer Genome Atlas cohort of pancreatic cancer patients (P < 0.0001, R = -0.4856); D: SIRT3 expression was lower in patients with higher ZEB1 expression, as suggested by immunohistochemistry (IHC) staining; E: SIRT3 expression was negatively and significantly correlated with ZEB1 expression, as demonstrated by IHC staining in pancreatic cancer patients (P = 0.0078, r = -0.4144). aP < 0.05, and bP < 0.01 vs NC or mock group. Error bars indicate mean ± SD. ZEB1: Zinc finger E-box binding homeobox-1; SIRT3: Sirtuin 3; IHC: Immunohistochemistry.
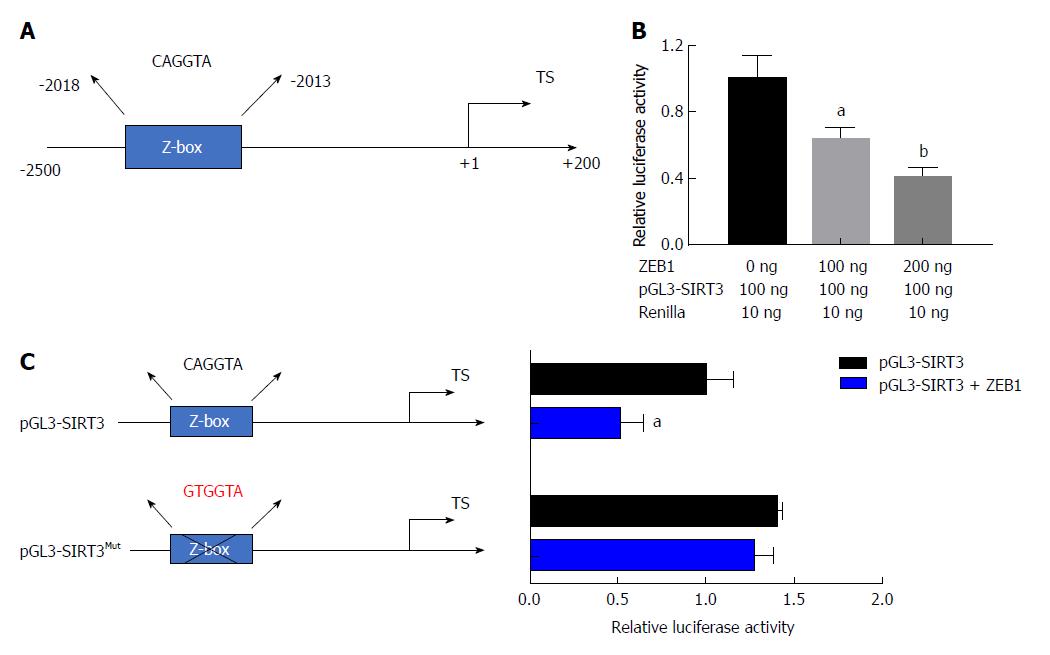
Figure 4 Sirtuin 3 is a transcriptional target of zinc finger E-box binding homeobox-1.
A: There is a specific zinc finger E-box binding homeobox-1 (ZEB1) binding element (Z-box: CAGGTA) in the promoter region of sirtuin 3 (SIRT3); B: ZEB1 suppressed SIRT3 promoter luciferase activity in a dose-dependent manner; C: The Z-box in the SIRT3 promoter was mutated from CAGGTA to GTGGTA to confirm that ZEB1 specifically regulated SIRT3 promoter activity; D: ZEB1 had a slight impact on mutated SIRT3 promoter luciferase activity, suggesting that ZEB1 regulated SIRT3 expression by Z-box specific binding. aP < 0.05, and bP < 0.01 vs NC or mock group. ZEB1: Zinc finger E-box binding homeobox-1; SIRT3: Sirtuin 3.
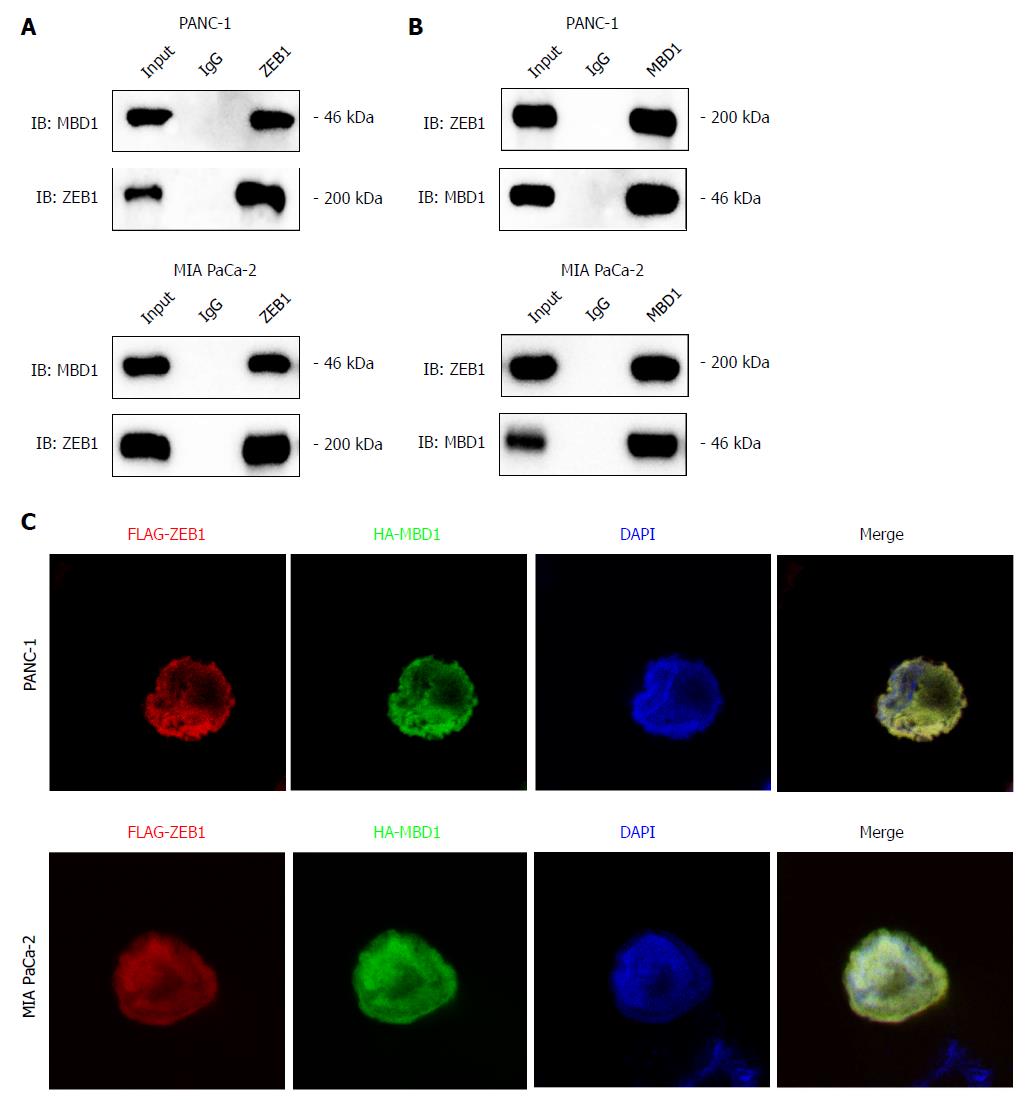
Figure 5 Epigenetic factor methyl-CpG binding domain protein 1 interacts with zinc finger E-box binding homeobox-1 in pancreatic cancer cells.
A and B: Co-immunoprecipitation assay with methyl-CpG binding domain protein 1 (MBD1) or zinc finger E-box binding homeobox-1 (ZEB1) antibody demonstrated that MBD1 interacted with ZEB1 in PANC-1 and MIA PaCa-2 cells; C: Immunofluoresence assay indicated that MBD1 colocalized with ZEB1 in the nucleus in PANC-1 and MIA PaCa-2 cells. MBD1: Methyl-CpG binding domain protein 1; ZEB1: Zinc finger E-box binding homeobox-1.
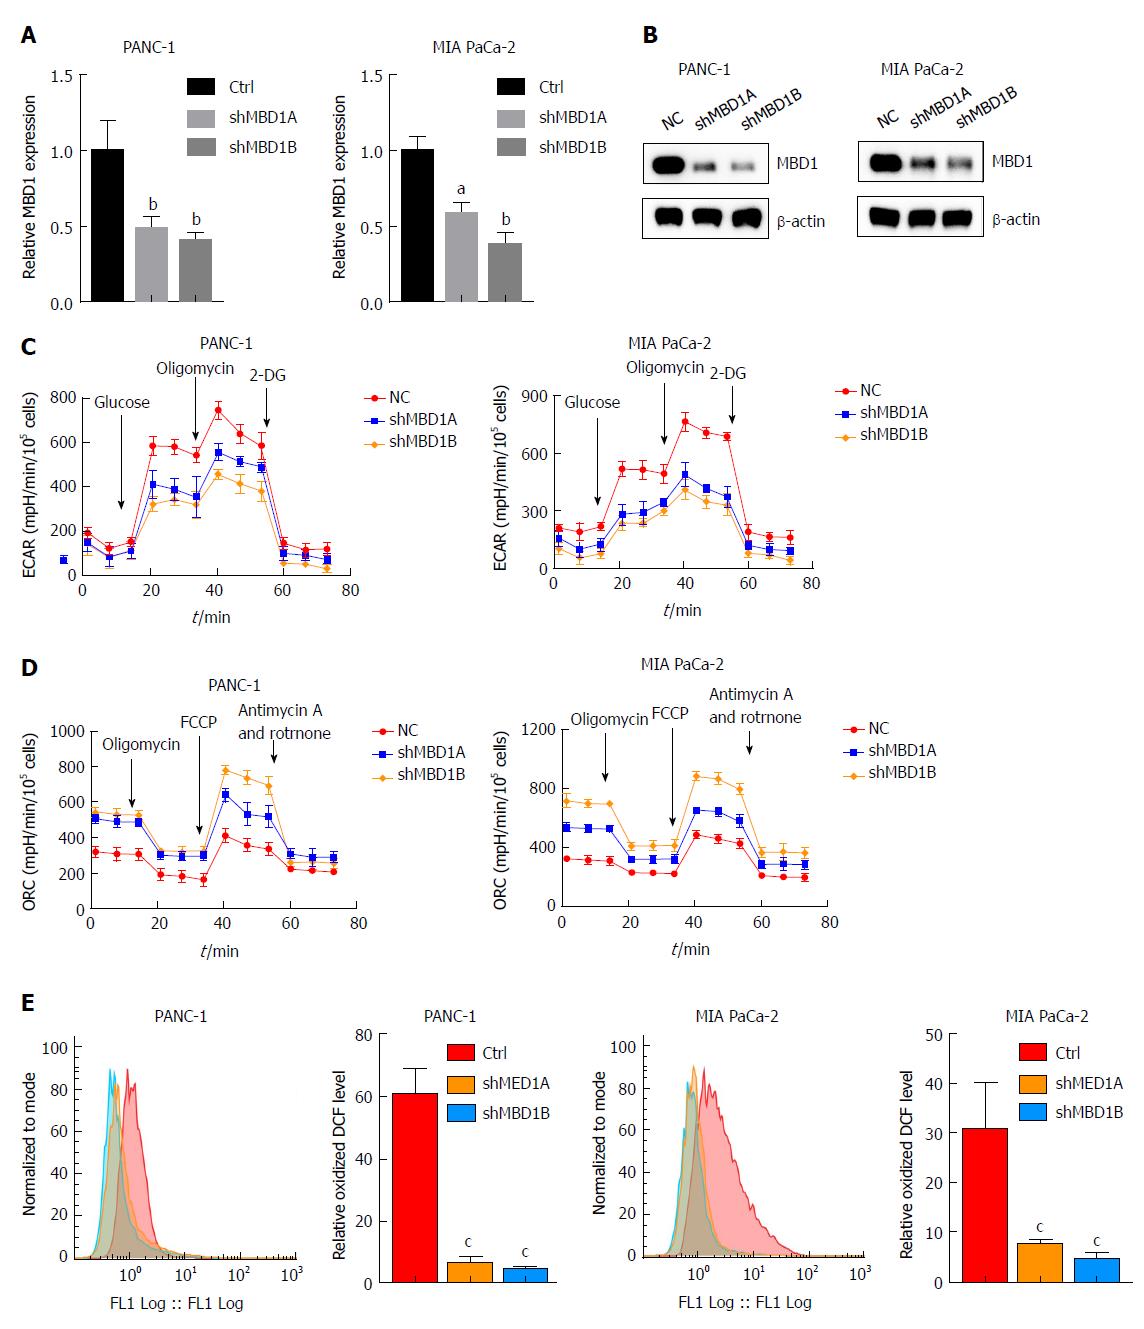
Figure 6 Methyl-CpG binding domain protein 1 positively regulates aerobic glycolysis and reactive oxygen species production in pancreatic cancer cells.
A and B: Real-time polymerase chain reaction and western blotting demonstrated that methyl-CpG binding domain protein 1 (MBD1) was silenced in PANC-1 and MIA PaCa-2 cells; C: Knockdown of MBD1 decreased extracellular acidification rate values, indicating that MBD1 was a positive regulator of glycolysis; D: Silencing MBD1 in PANC-1 and MIA PaCa-2 cells increased oxygen consumption rate values, suggesting that MBD1 negatively regulated mitochondrial respiration; E: Downregulation of MBD1 decreased reactive oxygen species generation in PANC-1 and MIA PaCa-2 cells. aP < 0.05, bP < 0.01, and cP < 0.001 vs NC or mock group. MBD1: Methyl-CpG binding domain protein 1; ECAR: Extracellular acidification rate; OCR: Oxygen consumption rate.
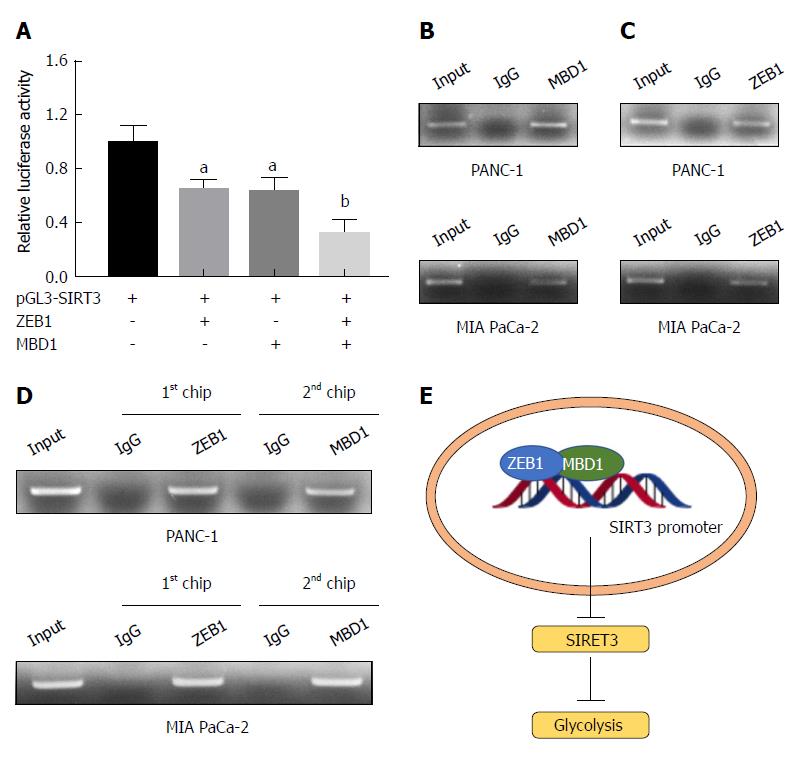
Figure 7 Zinc finger E-box binding homeobox-1 interacts with methyl-CpG binding domain protein 1 to suppress sirtuin 3 expression in pancreatic cancer cells.
A: Methyl-CpG binding domain protein 1 (MBD1) and zinc finger E-box binding homeobox-1 (ZEB1) repressed sirtuin 3 (SIRT3) promoter luciferase activity, and when cotransfected into HEK-293T cells, SIRT3 promoter activity more dramatically decreased than transfecting MBD1 or ZEB1 alone; B and C: Chromatin immunoprecipitation (ChIP) assay demonstrated that MBD1 and ZEB1 bound the Z-box region of the SIRT3 promoter; D: ChIP and re-ChIP assays demonstrated that MBD1 and ZEB1 jointly occupied the same Z-box region in the SIRT3 promoter; E: Schematic representation of the working model. aP < 0.05, and bP < 0.01 vs NC or mock group. Error bars indicate mean ± SD. ChIP: Chromatin immunoprecipitation; MBD1: Methyl-CpG binding domain protein 1; SIRT3: Sirtuin 3; ZEB1: Zinc finger E-box binding homeobox-1.
- Citation: Xu WY, Hu QS, Qin Y, Zhang B, Liu WS, Ni QX, Xu J, Yu XJ. Zinc finger E-box-binding homeobox 1 mediates aerobic glycolysis via suppression of sirtuin 3 in pancreatic cancer. World J Gastroenterol 2018; 24(43): 4893-4905
- URL: https://www.wjgnet.com/1007-9327/full/v24/i43/4893.htm
- DOI: https://dx.doi.org/10.3748/wjg.v24.i43.4893


