Copyright
©The Author(s) 2018.
World J Gastroenterol. Aug 7, 2018; 24(29): 3273-3280
Published online Aug 7, 2018. doi: 10.3748/wjg.v24.i29.3273
Published online Aug 7, 2018. doi: 10.3748/wjg.v24.i29.3273
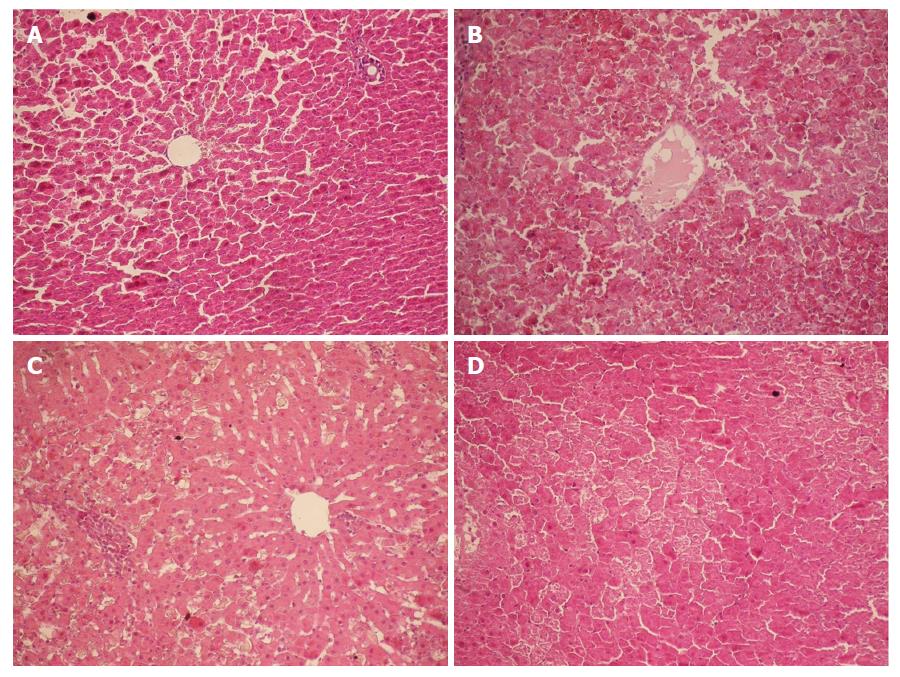
Figure 1 Histopathology of the liver (HE staining, × 200).
A: Group Normal Saline (NS). Normal hepatocytes were arranged in cords; B: Group D-galactosamine (D-GalN) plus lipopolysaccharide (LPS) (G/L). At 12 h, massive hepatocyte necrosis with severe hemorrhage developed; C: Group D-GaIN (G). At 12 h, spotty hepatocyte necrosis was observed; C: Group LPS (L). At 12 h, hepatocytes began to develop necrosis, with incomplete necrosis visible.
Figure 2 Histopathology of the kidney.
A: The glomerular basement membrane of the kidney was intact, and the foot processes of podocytes and fenestra of endothelial cells were clearly visible; B: The basal part of proximal tubule cubical epithelial cells had abundant plasma membrane infolding, which was rich in longitudinally arranged mitochondria with intact cristae. On the free surface of proximal tubule cubical epithelial cells, microvilli were long and dense; C: The basal part of distal tubule cubical epithelial cells also had abundant plasma membrane infolding, which was rich in mitochondria. On the free surface of distal tubule cubical epithelial cells, microvilli were short and sparse.
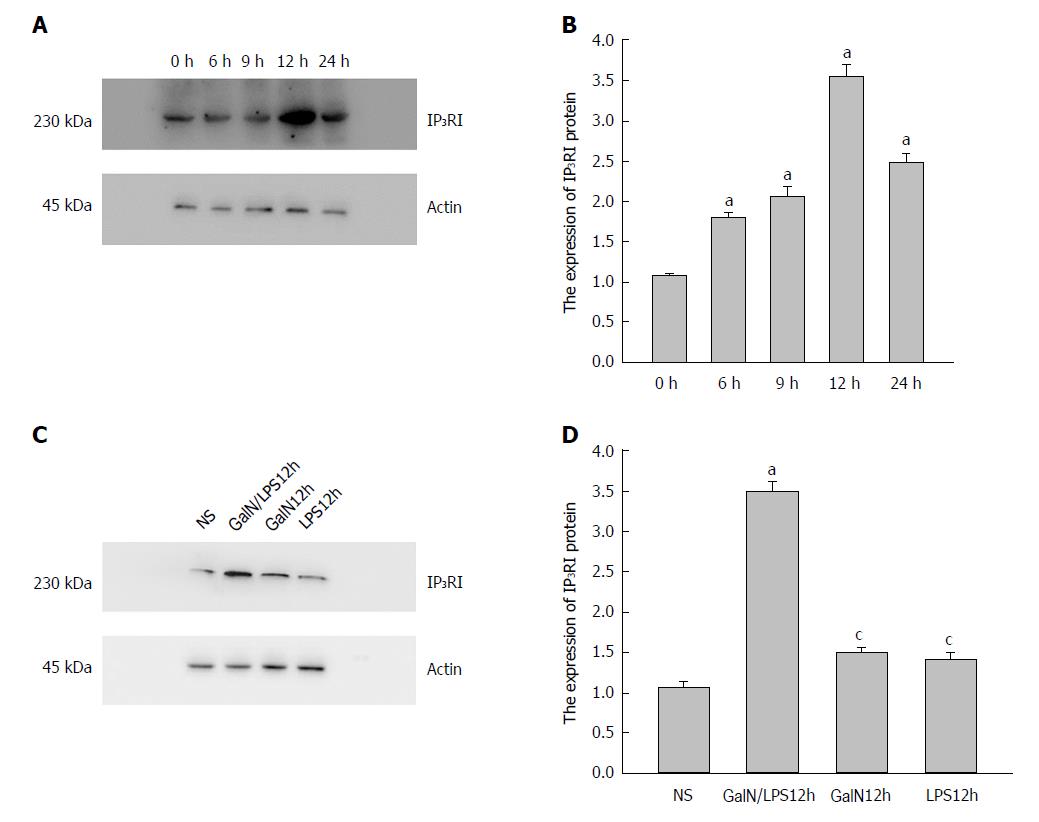
Figure 3 Expression of type I inositol 1,4,5-trisphosphate receptor (IP3RI) protein in the kidney of rats in each group.
A: The expression of IP3RI protein in the kidney significantly increased in group D-galactosamine (D-GalN) plus lipopolysaccharide (LPS) (G/L), and was especially prominent at 12 h [aP < 0.05 vs group Normal Saline (NS)]. B: The expression of IP3RI protein in the kidney significantly increased in group G/L compared with the other groups (aP < 0.05 vs group NS, cP < 0.05 vs group G/L).
Figure 4 Expression of type I inositol 1,4,5-trisphosphate receptor (IP3RI) mRNA in the kidney of rats in group D-galactosamine (D-GalN) plus lipopolysaccharide (LPS) (G/L).
The expression of IP3RI mRNA in the kidney significantly increased in group G/L, and was especially prominent at 12 h (aP < 0.05 vs group Normal Saline (NS), cP < 0.05 vs group G/L).
- Citation: Wang JB, Gu Y, Zhang MX, Yang S, Wang Y, Wang W, Li XR, Zhao YT, Wang HT. High expression of type I inositol 1,4,5-trisphosphate receptor in the kidney of rats with hepatorenal syndrome. World J Gastroenterol 2018; 24(29): 3273-3280
- URL: https://www.wjgnet.com/1007-9327/full/v24/i29/3273.htm
- DOI: https://dx.doi.org/10.3748/wjg.v24.i29.3273


