Copyright
©The Author(s) 2018.
World J Gastroenterol. Jul 28, 2018; 24(28): 3130-3144
Published online Jul 28, 2018. doi: 10.3748/wjg.v24.i28.3130
Published online Jul 28, 2018. doi: 10.3748/wjg.v24.i28.3130
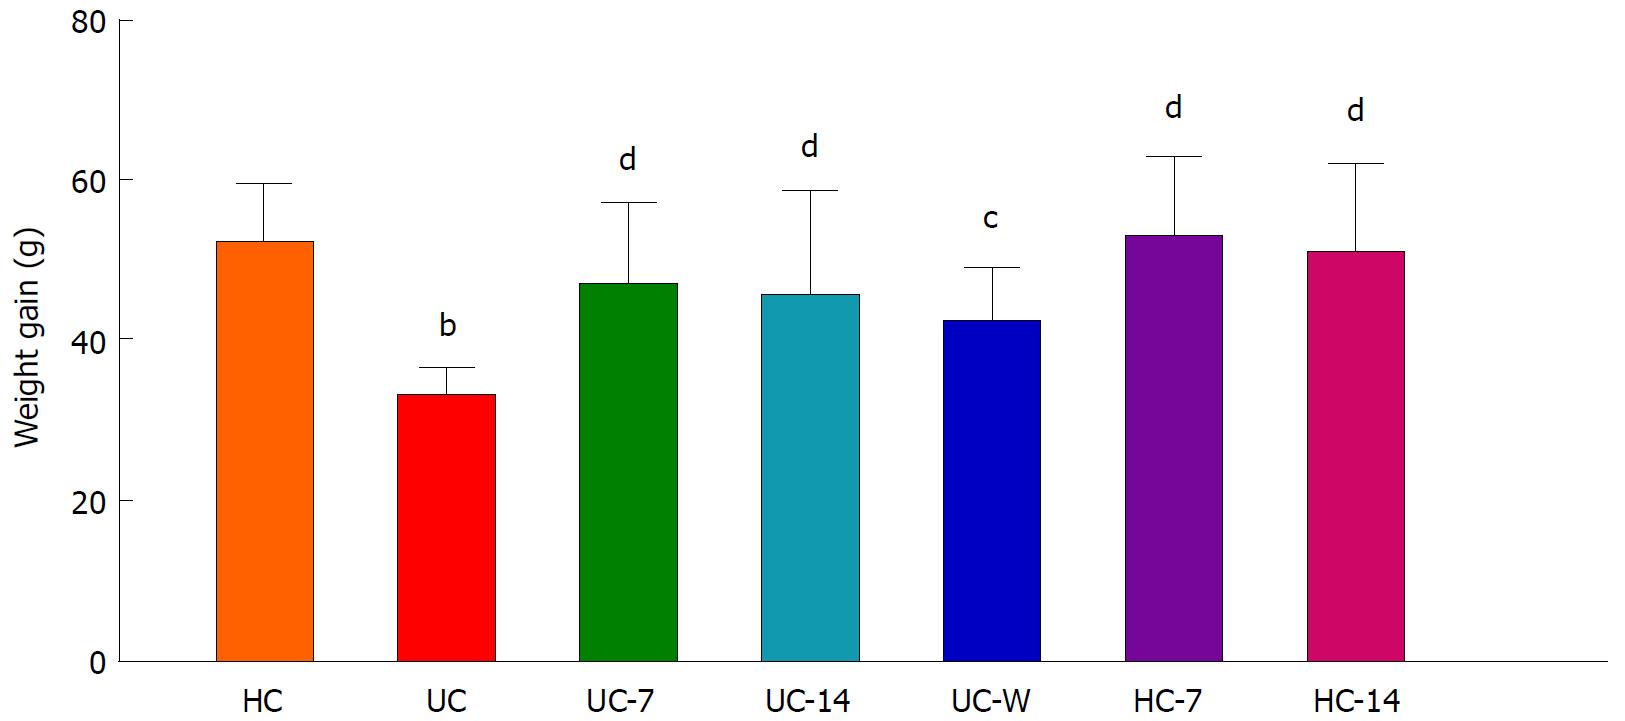
Figure 1 Body weight gains after treatment in different groups.
HC: Healthy controls; UC: UC model group; UC-7: UC model with seven days of moxibustion; UC-14: UC model with fourteen days of moxibustion; UC-W: UC model with mesalazine gavage; HC-7: Healthy controls with seven days of moxibustion; HC-14: healthy controls with fourteen days of moxibustion. The body weight gain in the UC group was decreased compared with the HC group (P < 0.01). After treatment, the body weight gains in the UC-7, UC-14, HC-7, HC-14 (P < 0.01) and UC-W (P < 0.05) groups were increased compared with the UC group. bP < 0.01 vs the HC group; cP < 0.05, dP < 0.01 vs the UC group.
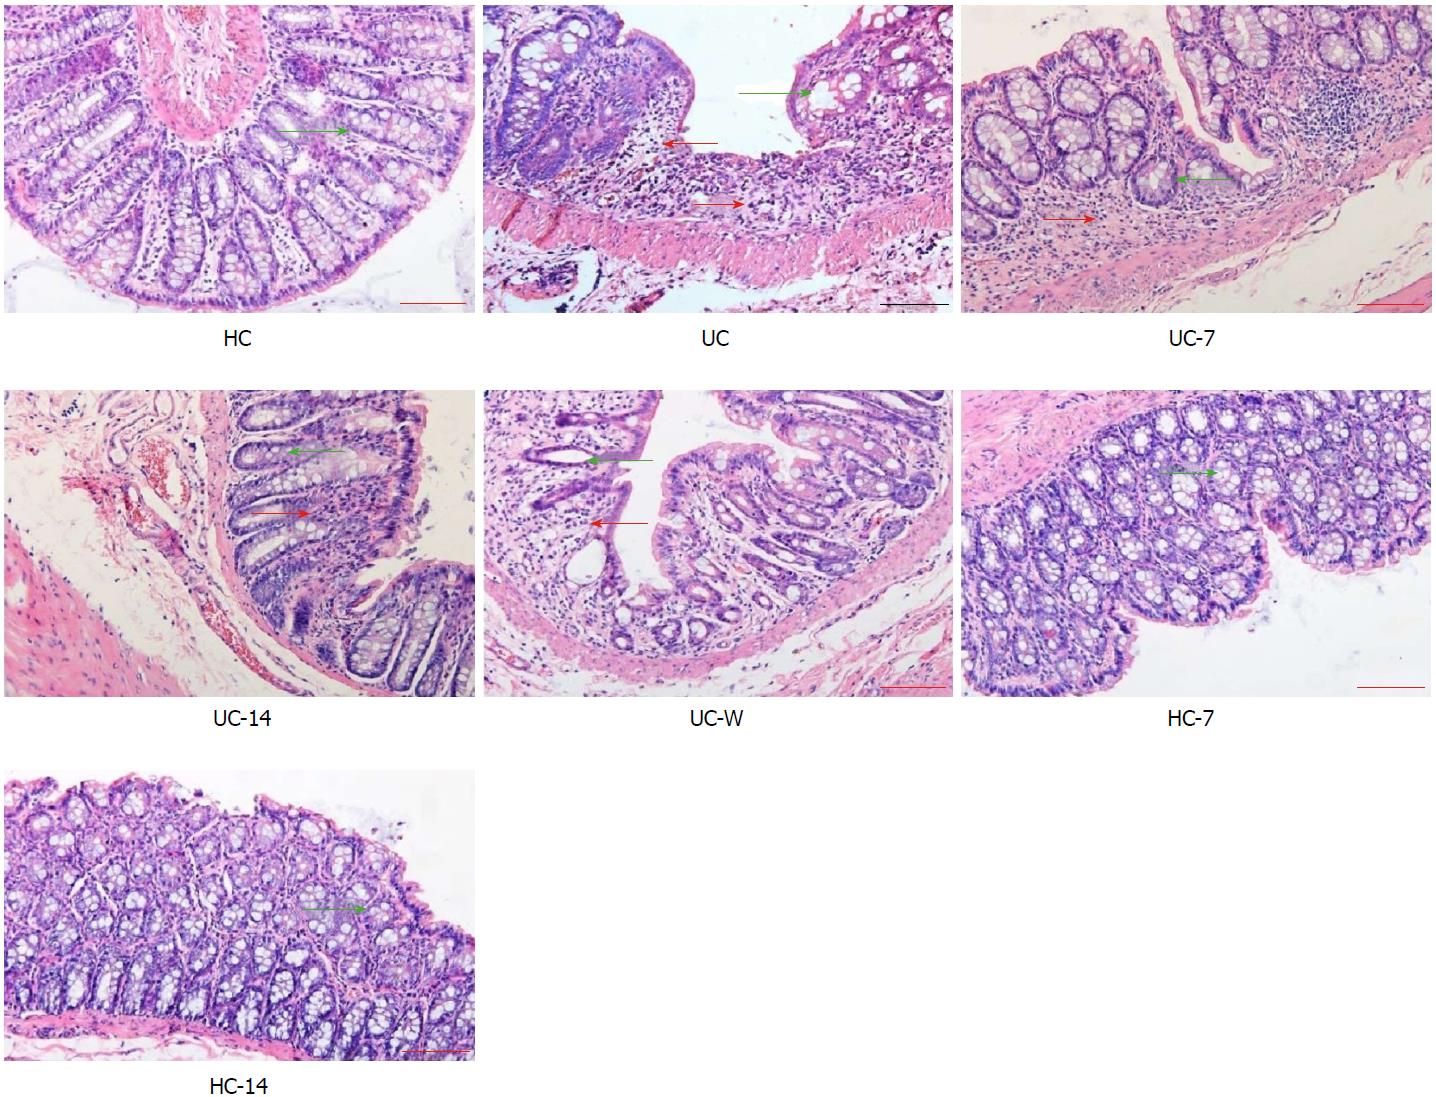
Figure 2 Rat colon tissue pathology under different treatments.
HC: Healthy controls; UC: UC model group; UC-7: UC model with seven days of moxibustion; UC-14: UC model with fourteen days of moxibustion; UC-W: UC model with mesalazine gavage; HC-7: Healthy controls with seven days of moxibustion; HC-14: Healthy controls with fourteen days of moxibustion. The colonic mucosa in HC, HC-7, and HC-14 rats exhibited no pathological abnormalities. The colonic mucosa was damaged in the UC group, with a reduction in the number of glands and cell infiltration. After moxibustion treatment, decreased cell infiltration and congestion were noted in the UC-7 and UC-14 groups. Glands were disorganized with abundant inflammatory cell infiltration in the UC-W group. Red arrow indicated inflammatory cell infiltration and green arrow indicate gland (magnification: 200 ×).
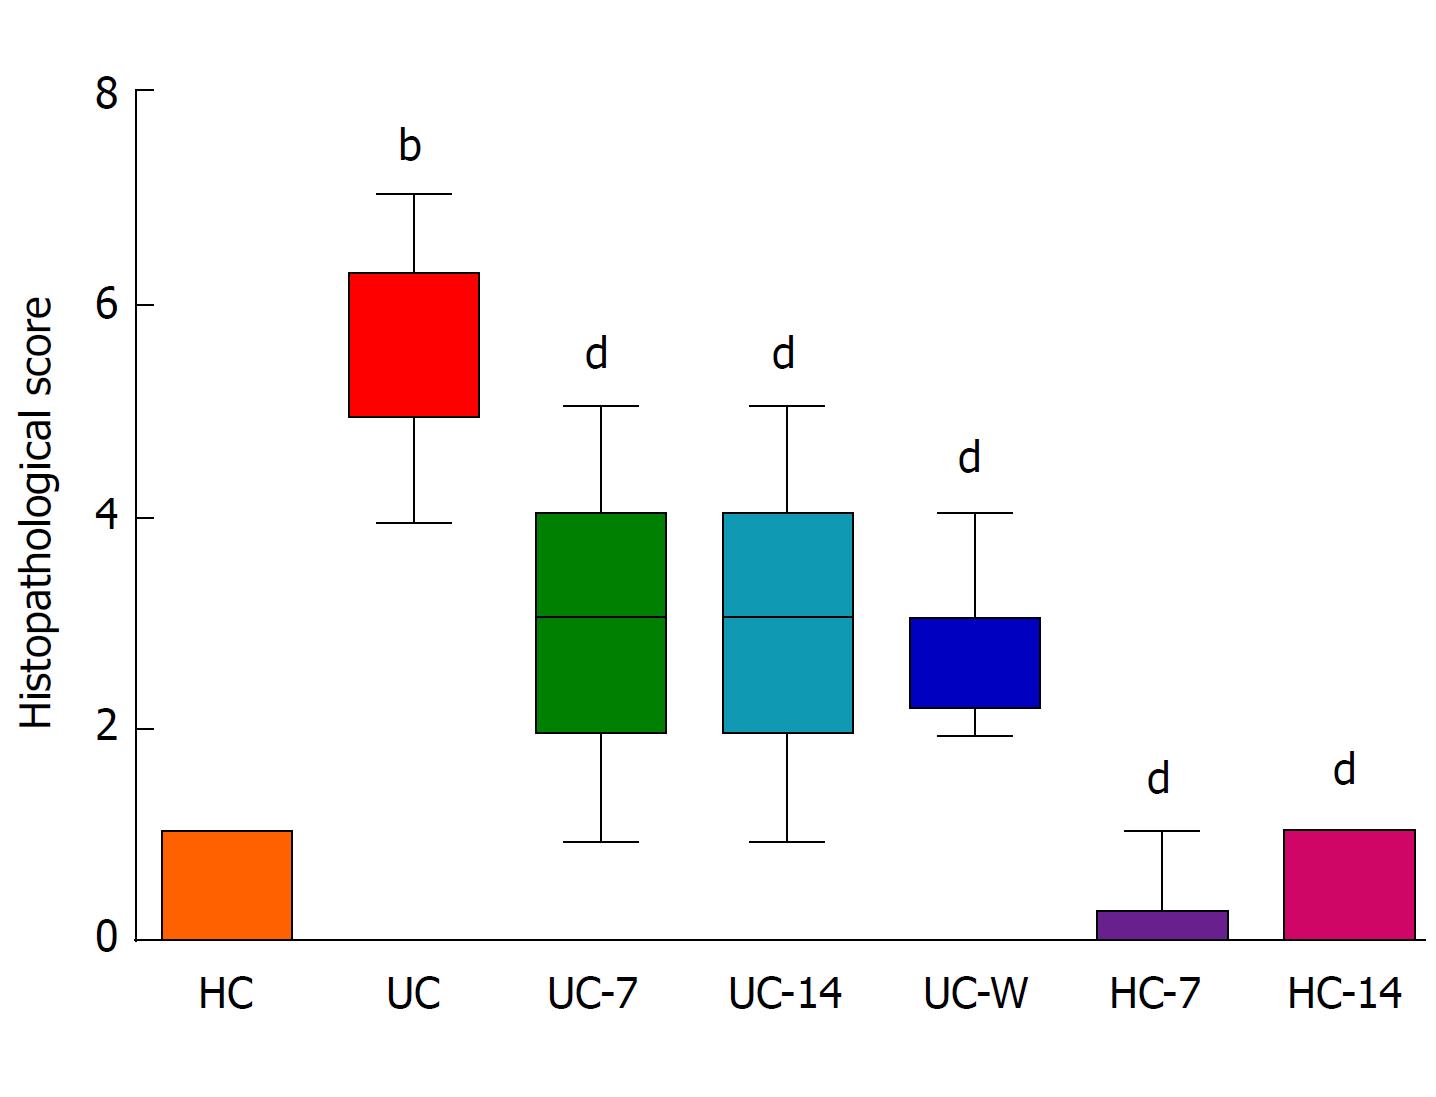
Figure 3 Histopathological scores for colon tissue in the different groups.
HC: Healthy controls; UC: UC model group; UC-7: UC model with seven days of moxibustion; UC-14: UC model with fourteen days of moxibustion; UC-W: UC model with mesalazine gavage; HC-7: Healthy controls with seven days of moxibustion; HC-14: Healthy controls with fourteen days of moxibustion. The histopathological scores in the UC group were significantly increased compared with the HC group (P < 0.01). After treatment, the scores were decreased in the UC-7, UC-14, UC-W, HC-7 and HC-14 groups compared with the UC group (P < 0.01). bP < 0.01 vs the HC group; dP < 0.01 vs the UC group.
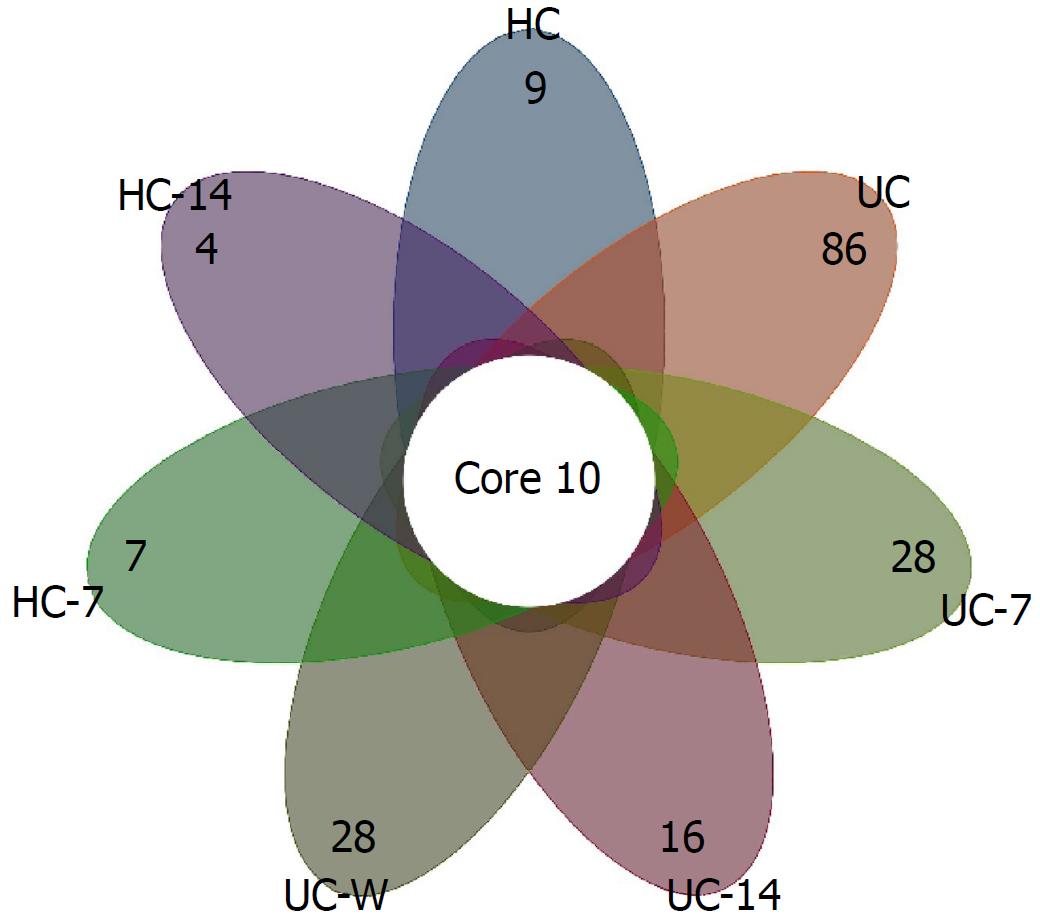
Figure 4 Summary of operational taxonomic units identified at the genus level in each group.
HC: Healthy controls; UC: UC model group; UC-7: UC model with seven days of moxibustion; UC-14: UC model with fourteen days of moxibustion; UC-W: UC model with mesalazine gavage; HC-7: Healthy controls with seven days of moxibustion; HC-14: Healthy controls with fourteen days of moxibustion. There were ten core operational taxonomic units in all groups. The UC group had the most unique genera.
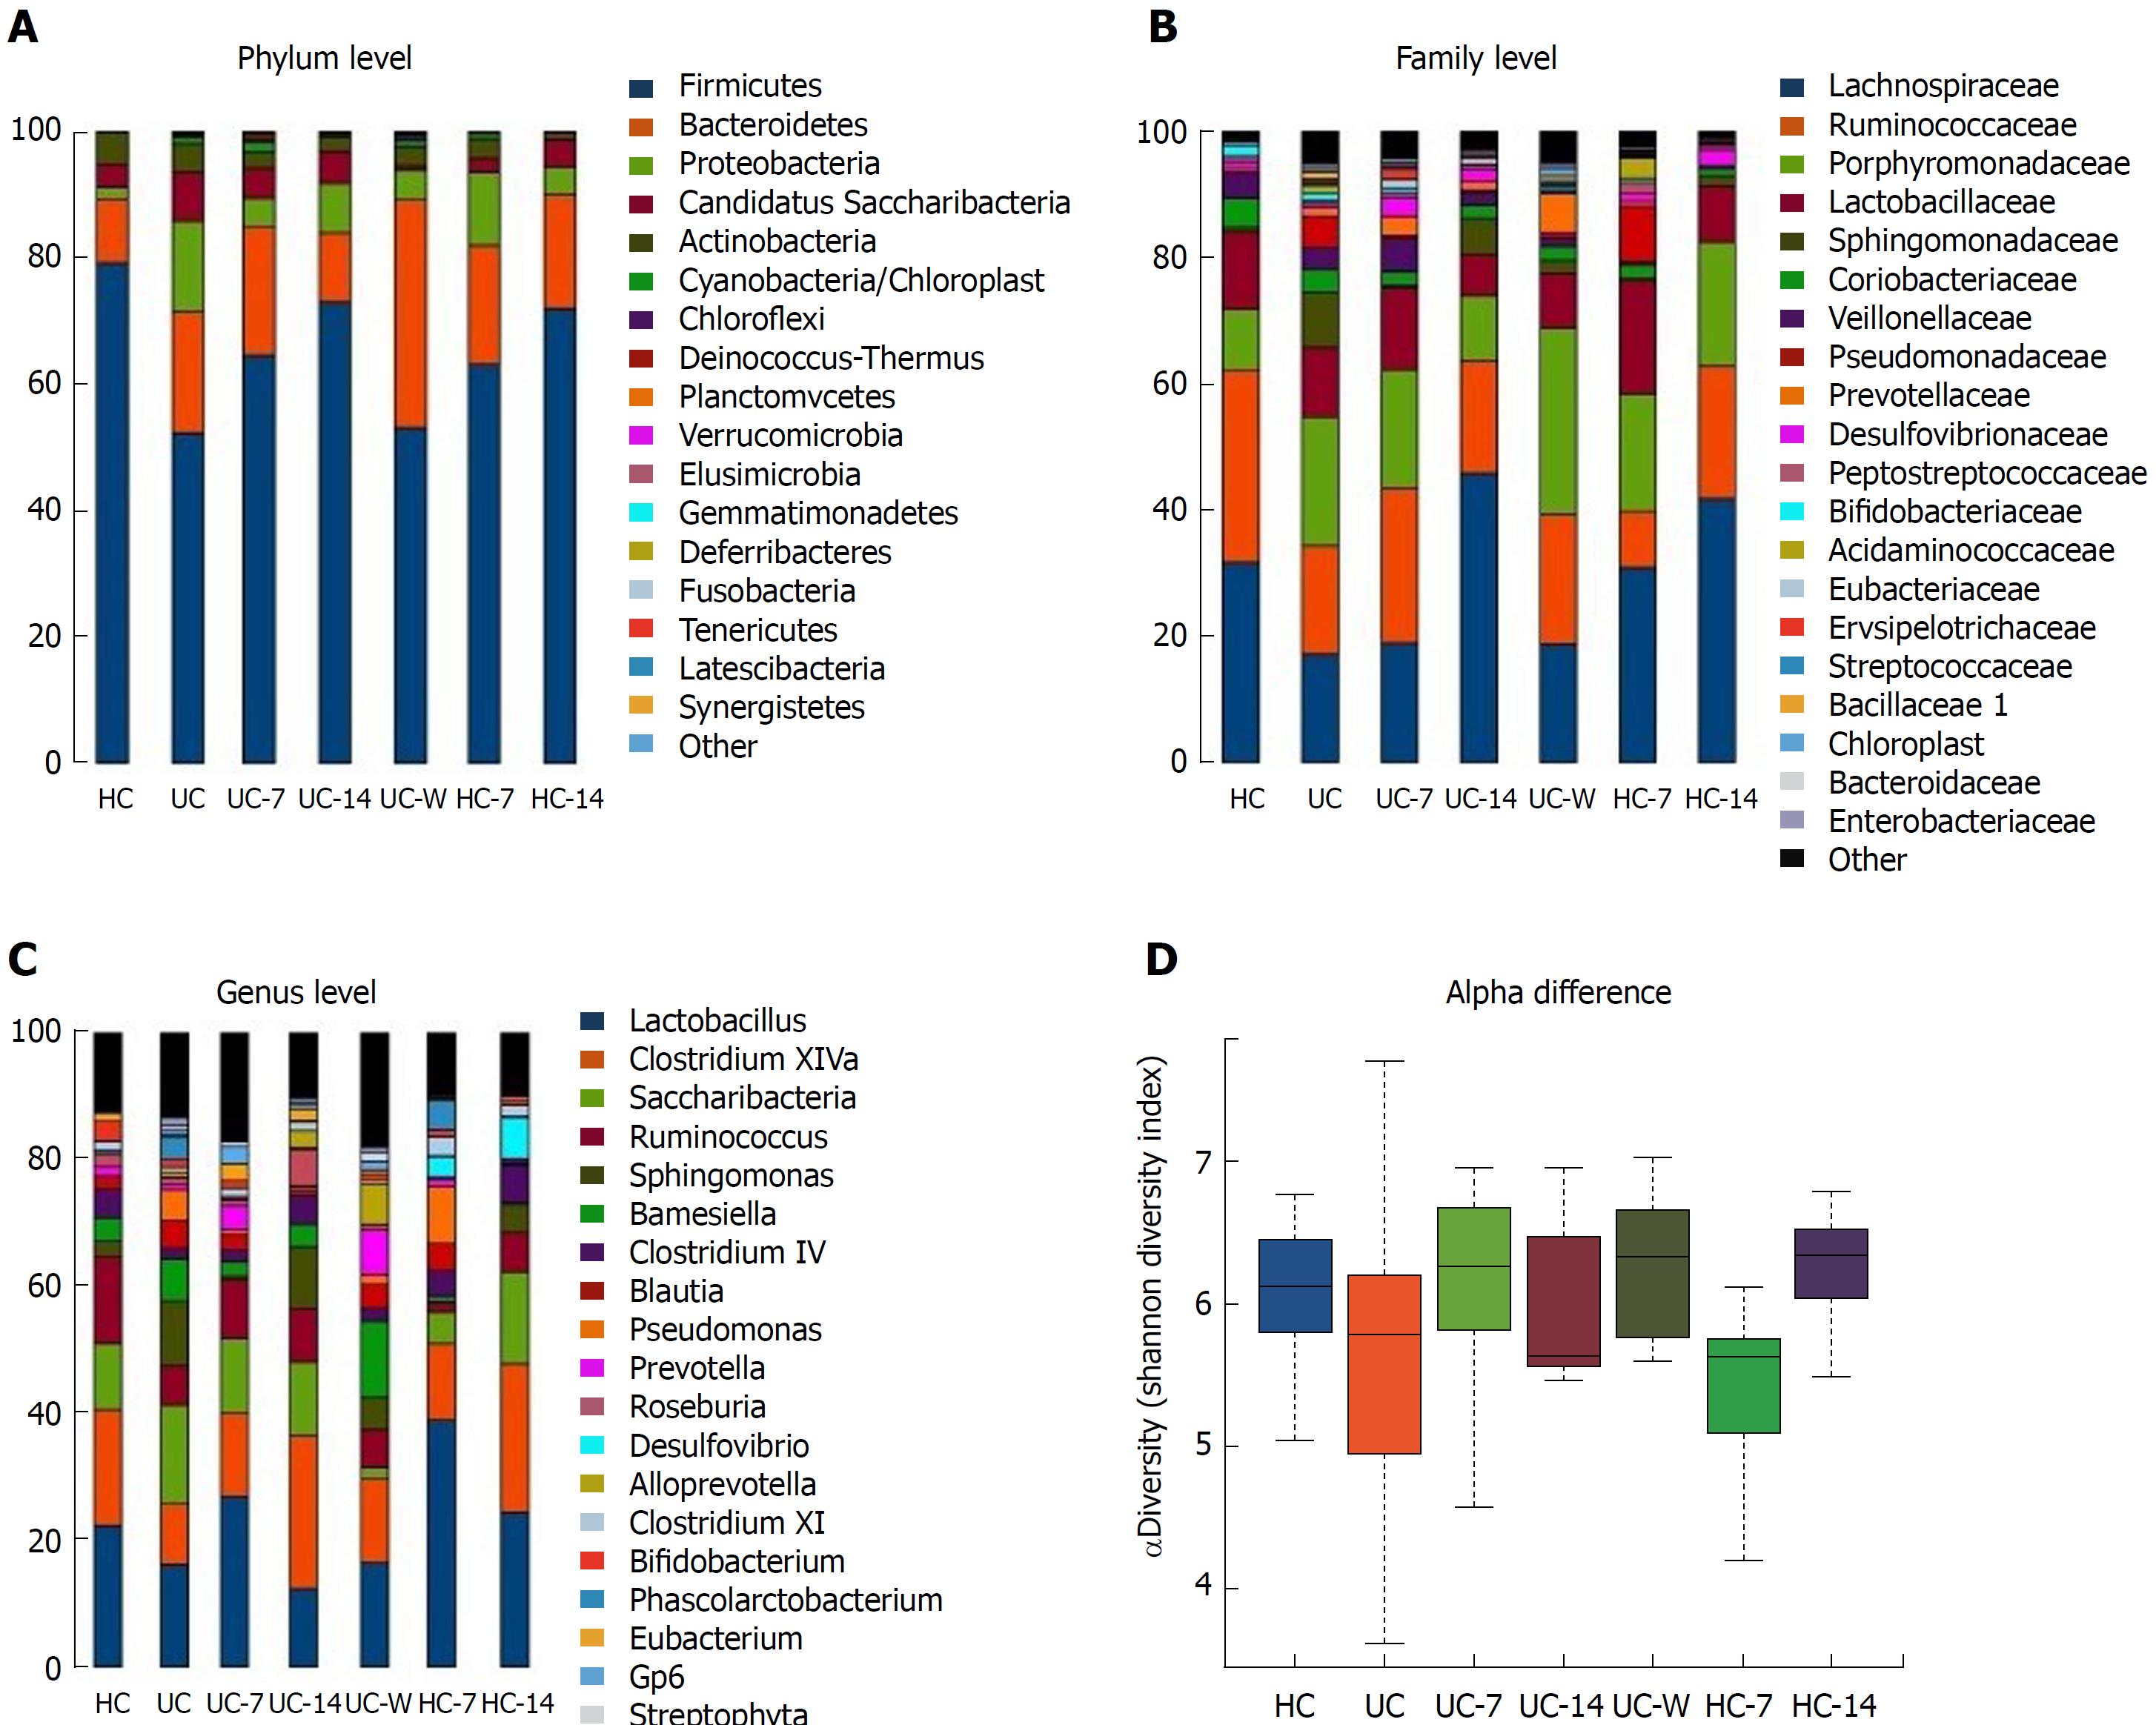
Figure 5 Comparative analyses of the dominant phyla, families and genera under different treatments.
HC: Healthy controls; UC: UC model group; UC-7: UC model with seven days of moxibustion; UC-14: UC model with fourteen days of moxibustion; UC-W: UC model with mesalazine gavage; HC-7: Healthy controls with seven days of moxibustion; HC-14: Healthy controls with fourteen days of moxibustion. A: The relative abundance levels of Proteobacteria, Candidatus, and Saccharibacteria were increased, whereas Firmicutes and Actinobacteria were decreased in the UC group compared with the HC group. These changes in microbiota profiles could be reversed by moxibustion treatment for seven days or fourteen days; B: UC rats had decreased Lactobacillaceae and Ruminococcaceae and increased Sphingomonadaceae, Pseudomonadaceae, and Porphyromonadaceae compared with the HC group. After treatment, Pseudomonadaceae was reduced in the UC-7, UC-14 and UC-W groups compared with the UC group; C: Lactobacillus, Clostridium XlVa, and Ruminococcus were increased and Saccharibacteria and Sphingomonas were decreased in HC rats compared with UC rats; D: UC rats had decreased alpha diversity compared with HC rats. After treatment, alpha diversity was increased in the UC-7 and UC-W groups.
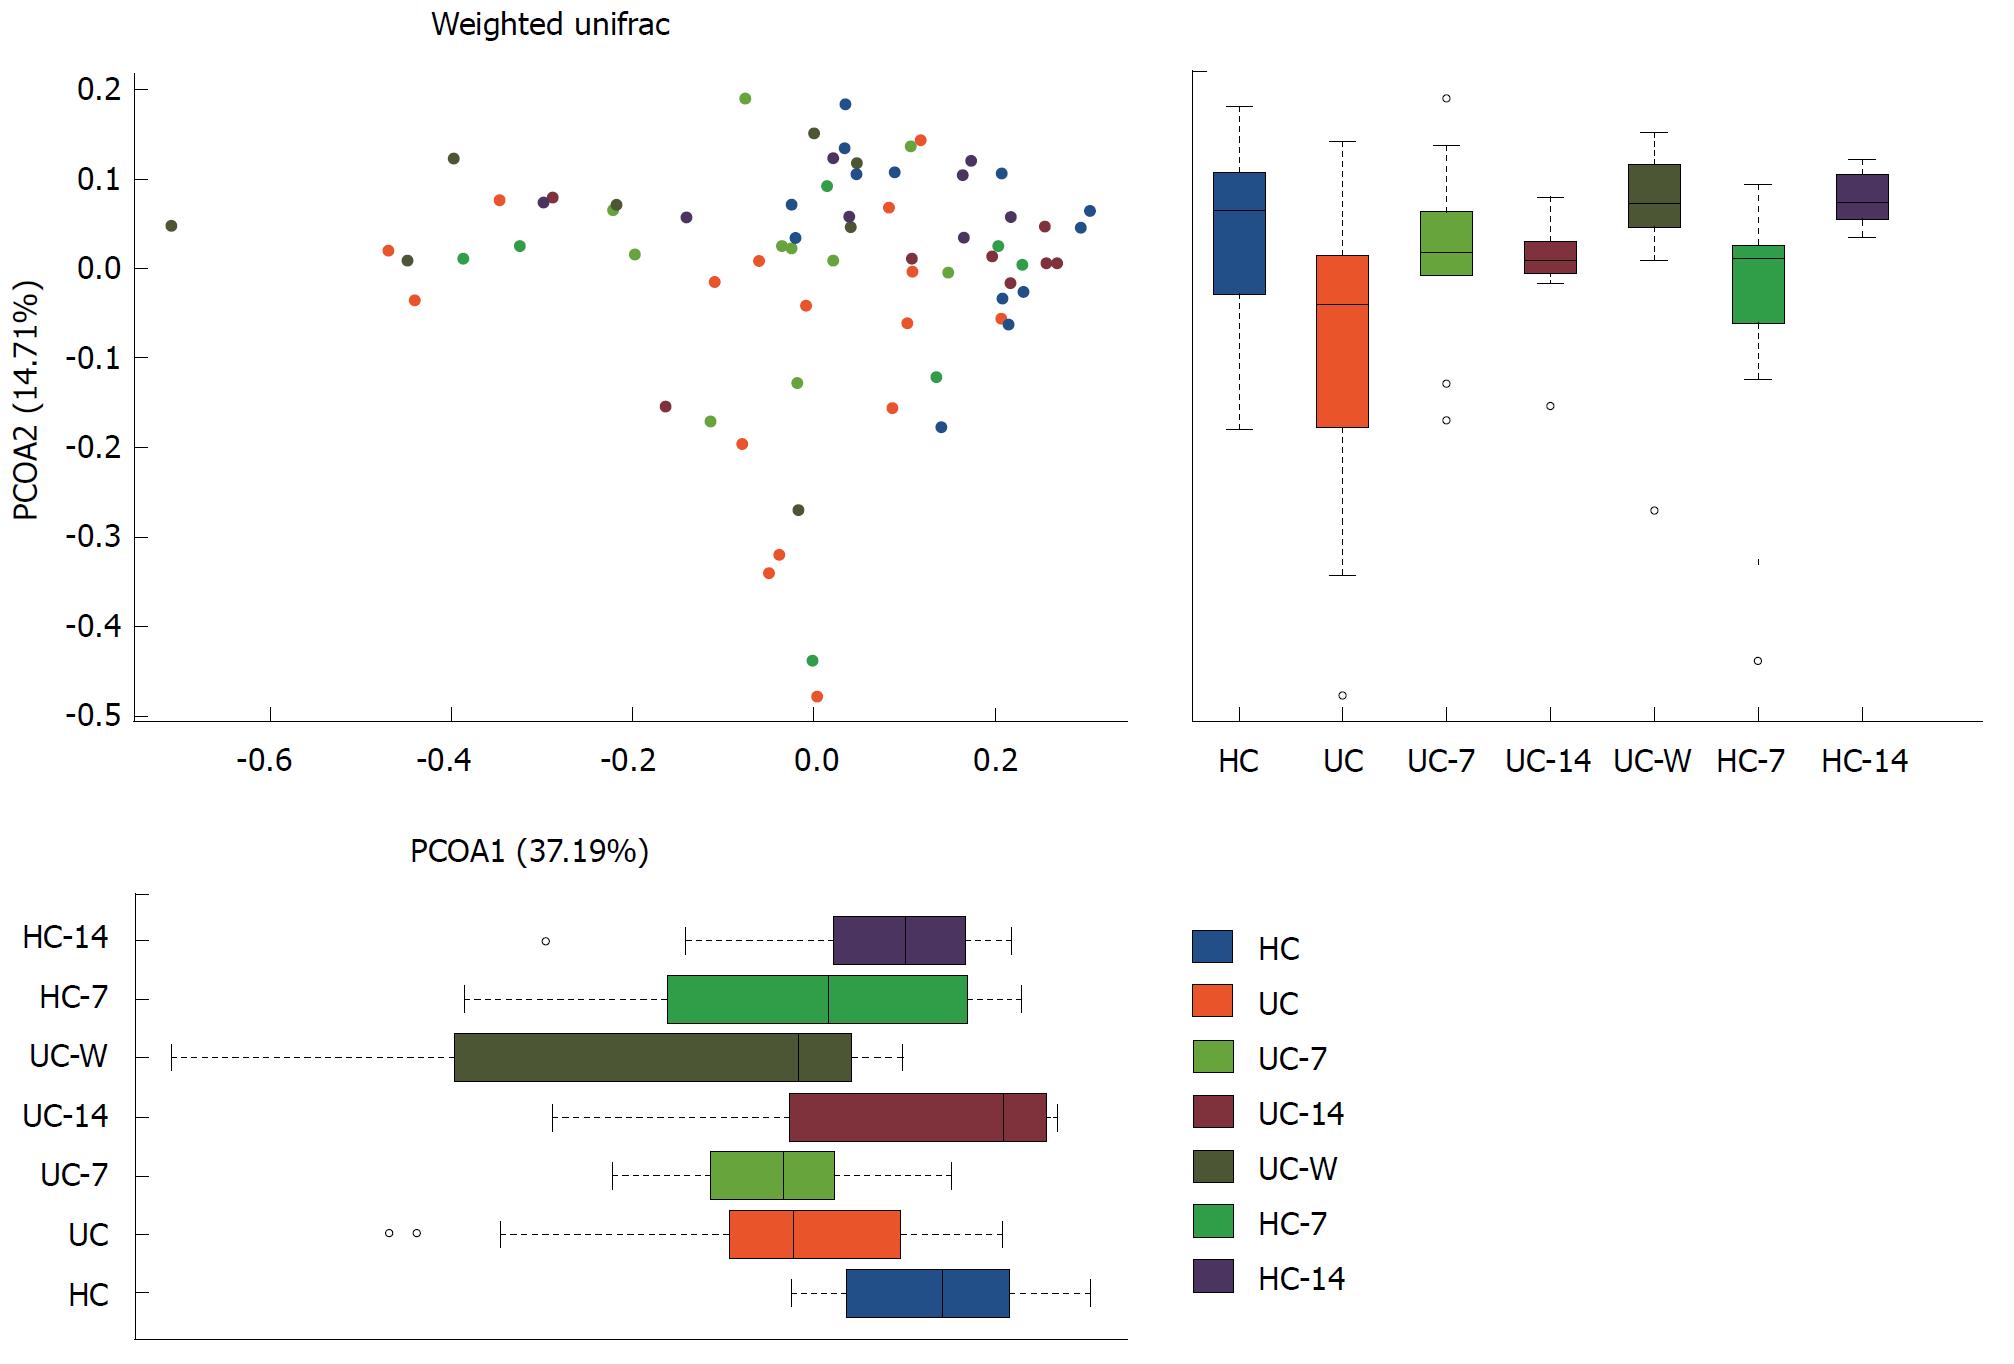
Figure 6 Beta diversity analyses by PCoA.
HC: Healthy controls; UC: UC Model group; UC-7: UC model with seven days of moxibustion; UC-14: UC model with fourteen days of moxibustion; UC-W: UC model with mesalazine gavage; HC-7: Healthy controls with seven days of moxibustion; HC-14: Healthy controls with fourteen days of moxibustion. UC samples clustered separately from HC samples. The UC-7 group was more similar to the UC-W group on the first axis, whereas the HC-7 and HC-14 groups were more similar to the HC and UC-14 groups. Sample colour is based on treatment group.
Figure 7 Non-metric multidimensional scaling between groups.
HC: Healthy controls; UC: UC model group; UC-7: UC model with seven days of moxibustion; UC-14: UC model with fourteen days of moxibustion; UC-W: UC model with mesalazine gavage; HC-7: Healthy controls with seven days of moxibustion; HC-14: Healthy controls with fourteen days of moxibustion. UC samples clustered separately from HC samples. UC -7 was more similar to UC-W on the first axis. Sample colour is based on treatment group.
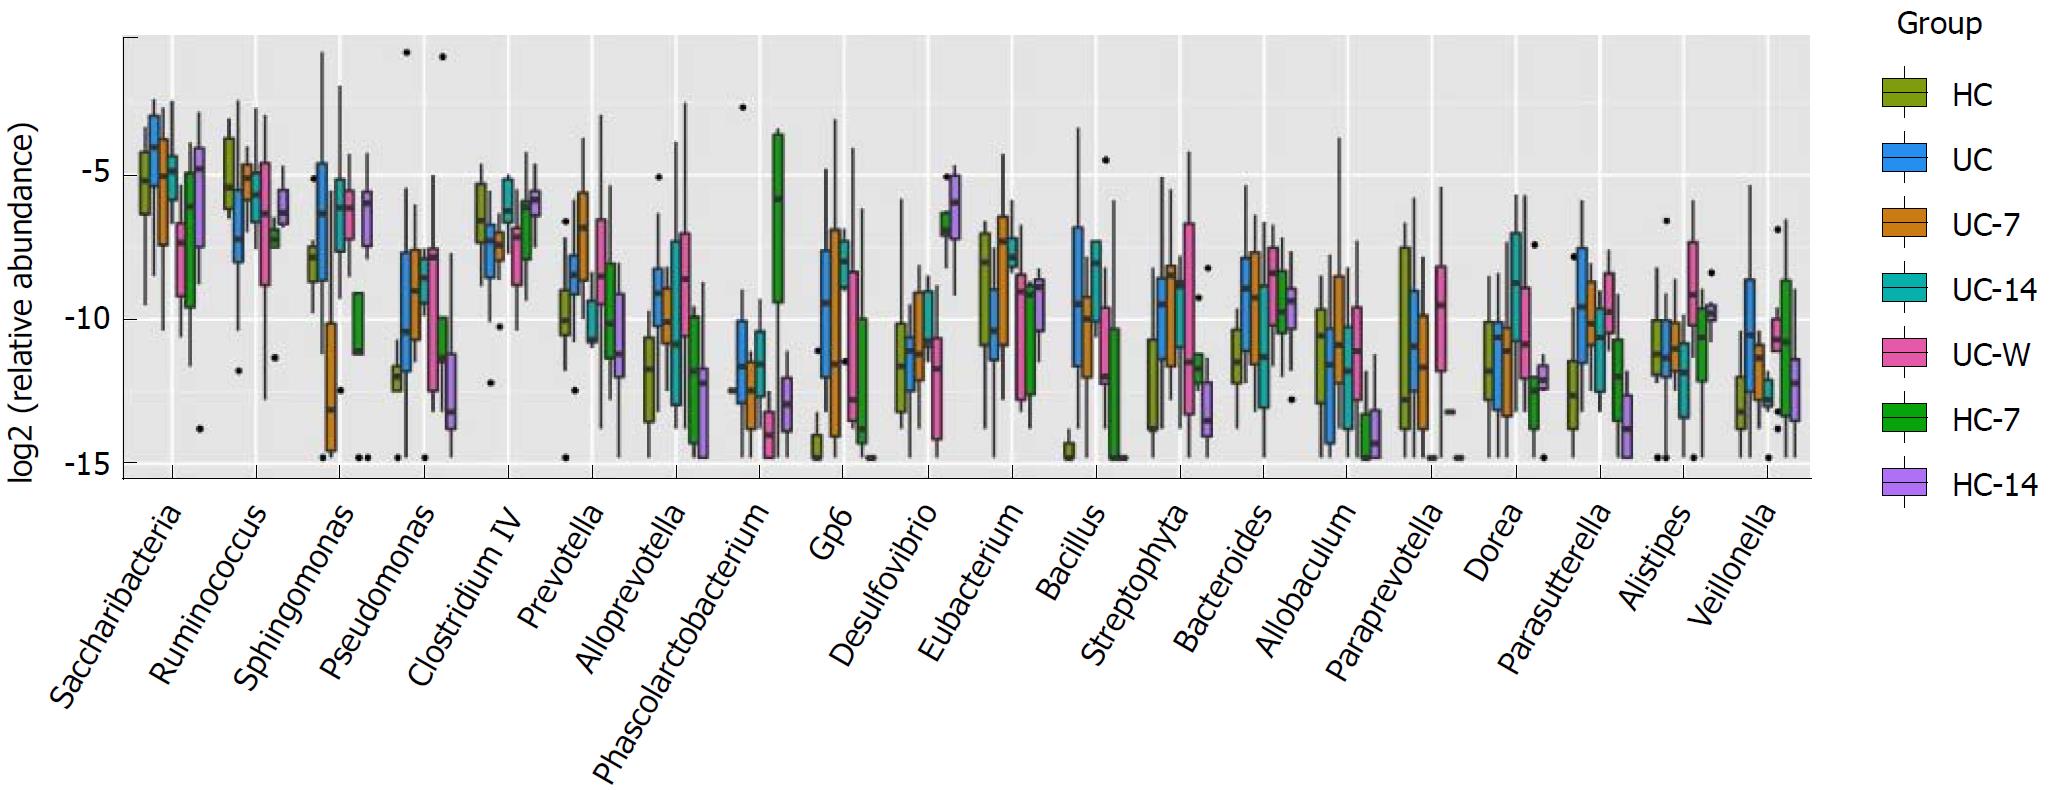
Figure 8 Genus-level differences between treatment groups.
HC: Healthy controls; UC: UC model group; UC-7: UC model with seven days of moxibustion; UC-14: UC model with fourteen days of moxibustion; UC-W: UC model with mesalazine gavage; HC-7: Healthy controls with seven days of moxibustion; HC-14: Healthy controls with fourteen days of moxibustion. UC rats had a higher density of Bacteroidetes and a lower Clostridium IV density compared with HC rats.
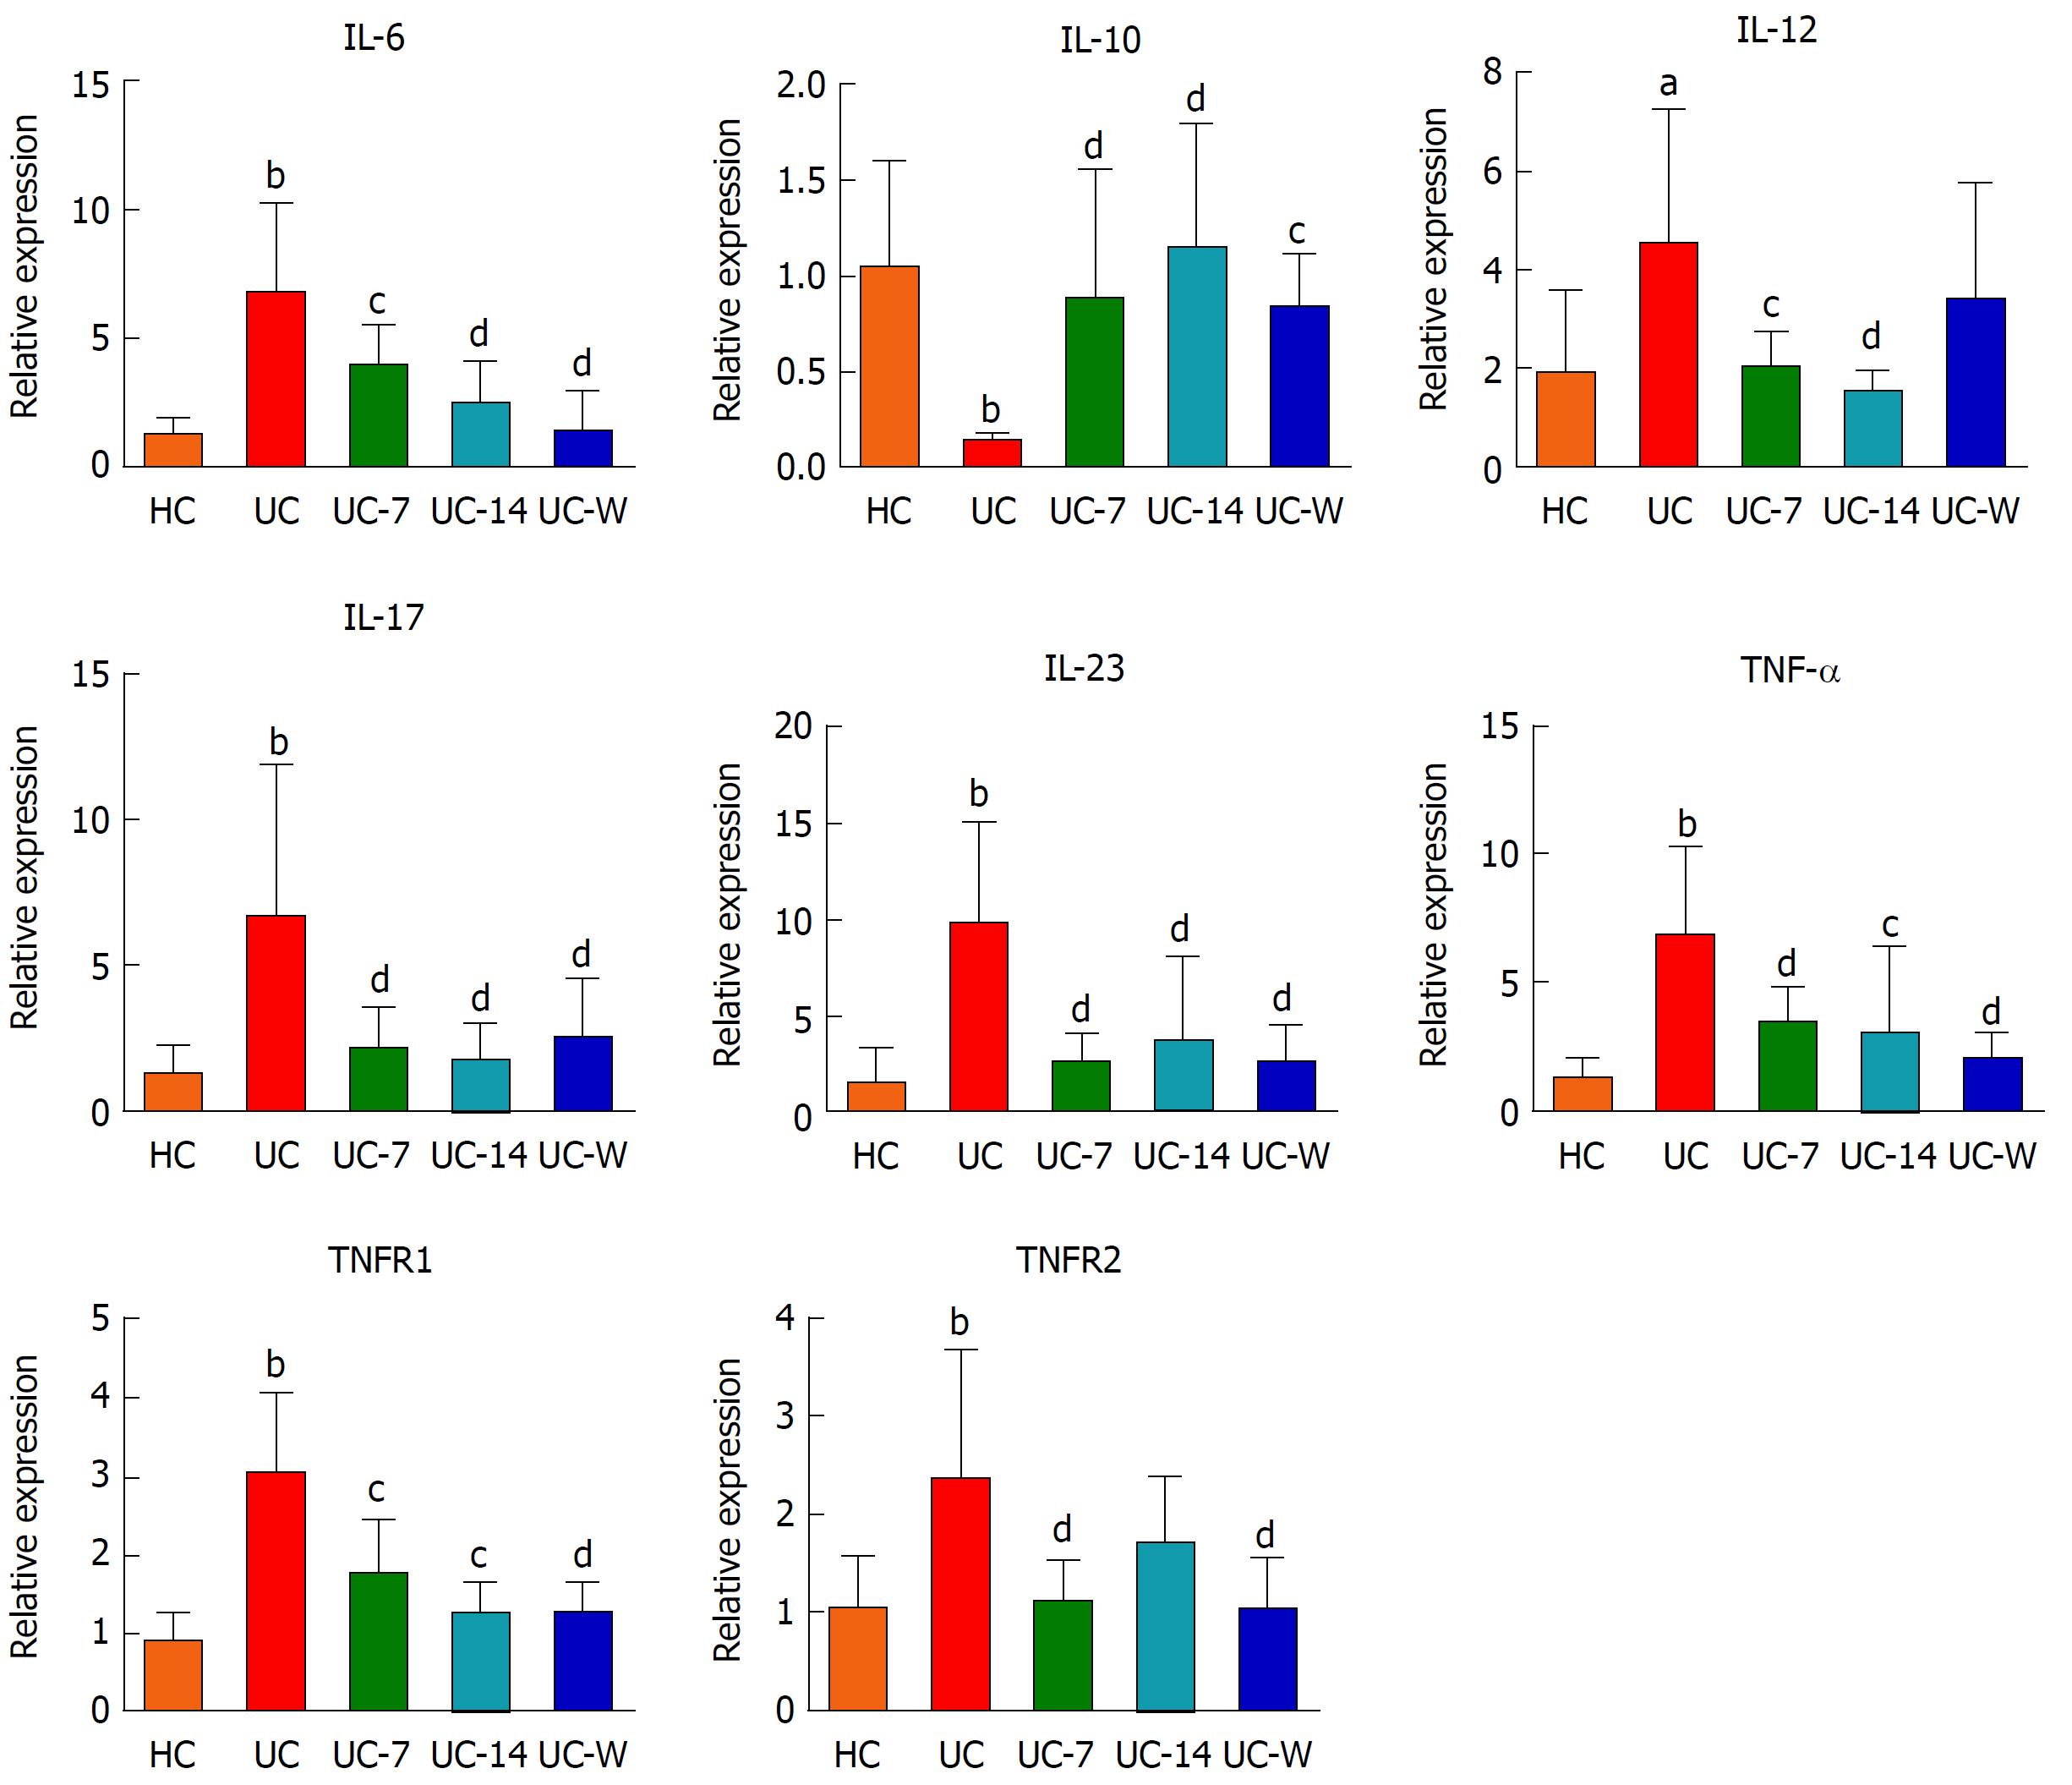
Figure 9 The relative expression levels of IL-6, IL-10, IL-12, IL-17, IL-23, TNF-α, TNFR1 and TNFR2 in colon mucosa.
HC: Healthy controls; UC: UC model group; UC-7: UC model with seven days of moxibustion; UC-14: UC model with fourteen days of moxibustion; UC-W: UC model with mesalazine gavage. The relative expression levels of IL-12 (P < 0.05), IL-6, IL-17, IL-23, TNF-α, TNFR1 and TNFR2 (P < 0.01) in the UC group were increased compared with the HC group. IL-10 (P < 0.01) expression levels in the UC group were decreased compared with the HC group. IL-17, IL-23, TNF-α, TNFR2 (P < 0.01), IL-6, IL-12, and TNFR1 (P < 0.05) expression levels were decreased in the UC-7 group compared with the UC group. TNF-α, TNFR1 (P < 0.05), IL-12, IL-6, IL-17, and IL-23 (P < 0.01) expression levels in the UC-14 group were decreased compared with UC rats. IL-10 was higher in the UC-7 group (P < 0.01), the UC-14 group (P < 0.01), and the UC-W group (P < 0.05) compared to the UC group. IL-6, IL-17, IL-23, TNF-α, TNFR1, and TNFR2 (P < 0.01) expression levels were decreased in the UC-W group compared with the UC group. aP < 0.05, bP < 0.01 vs the HC group; cP < 0.05, dP < 0.01 vs the UC group.
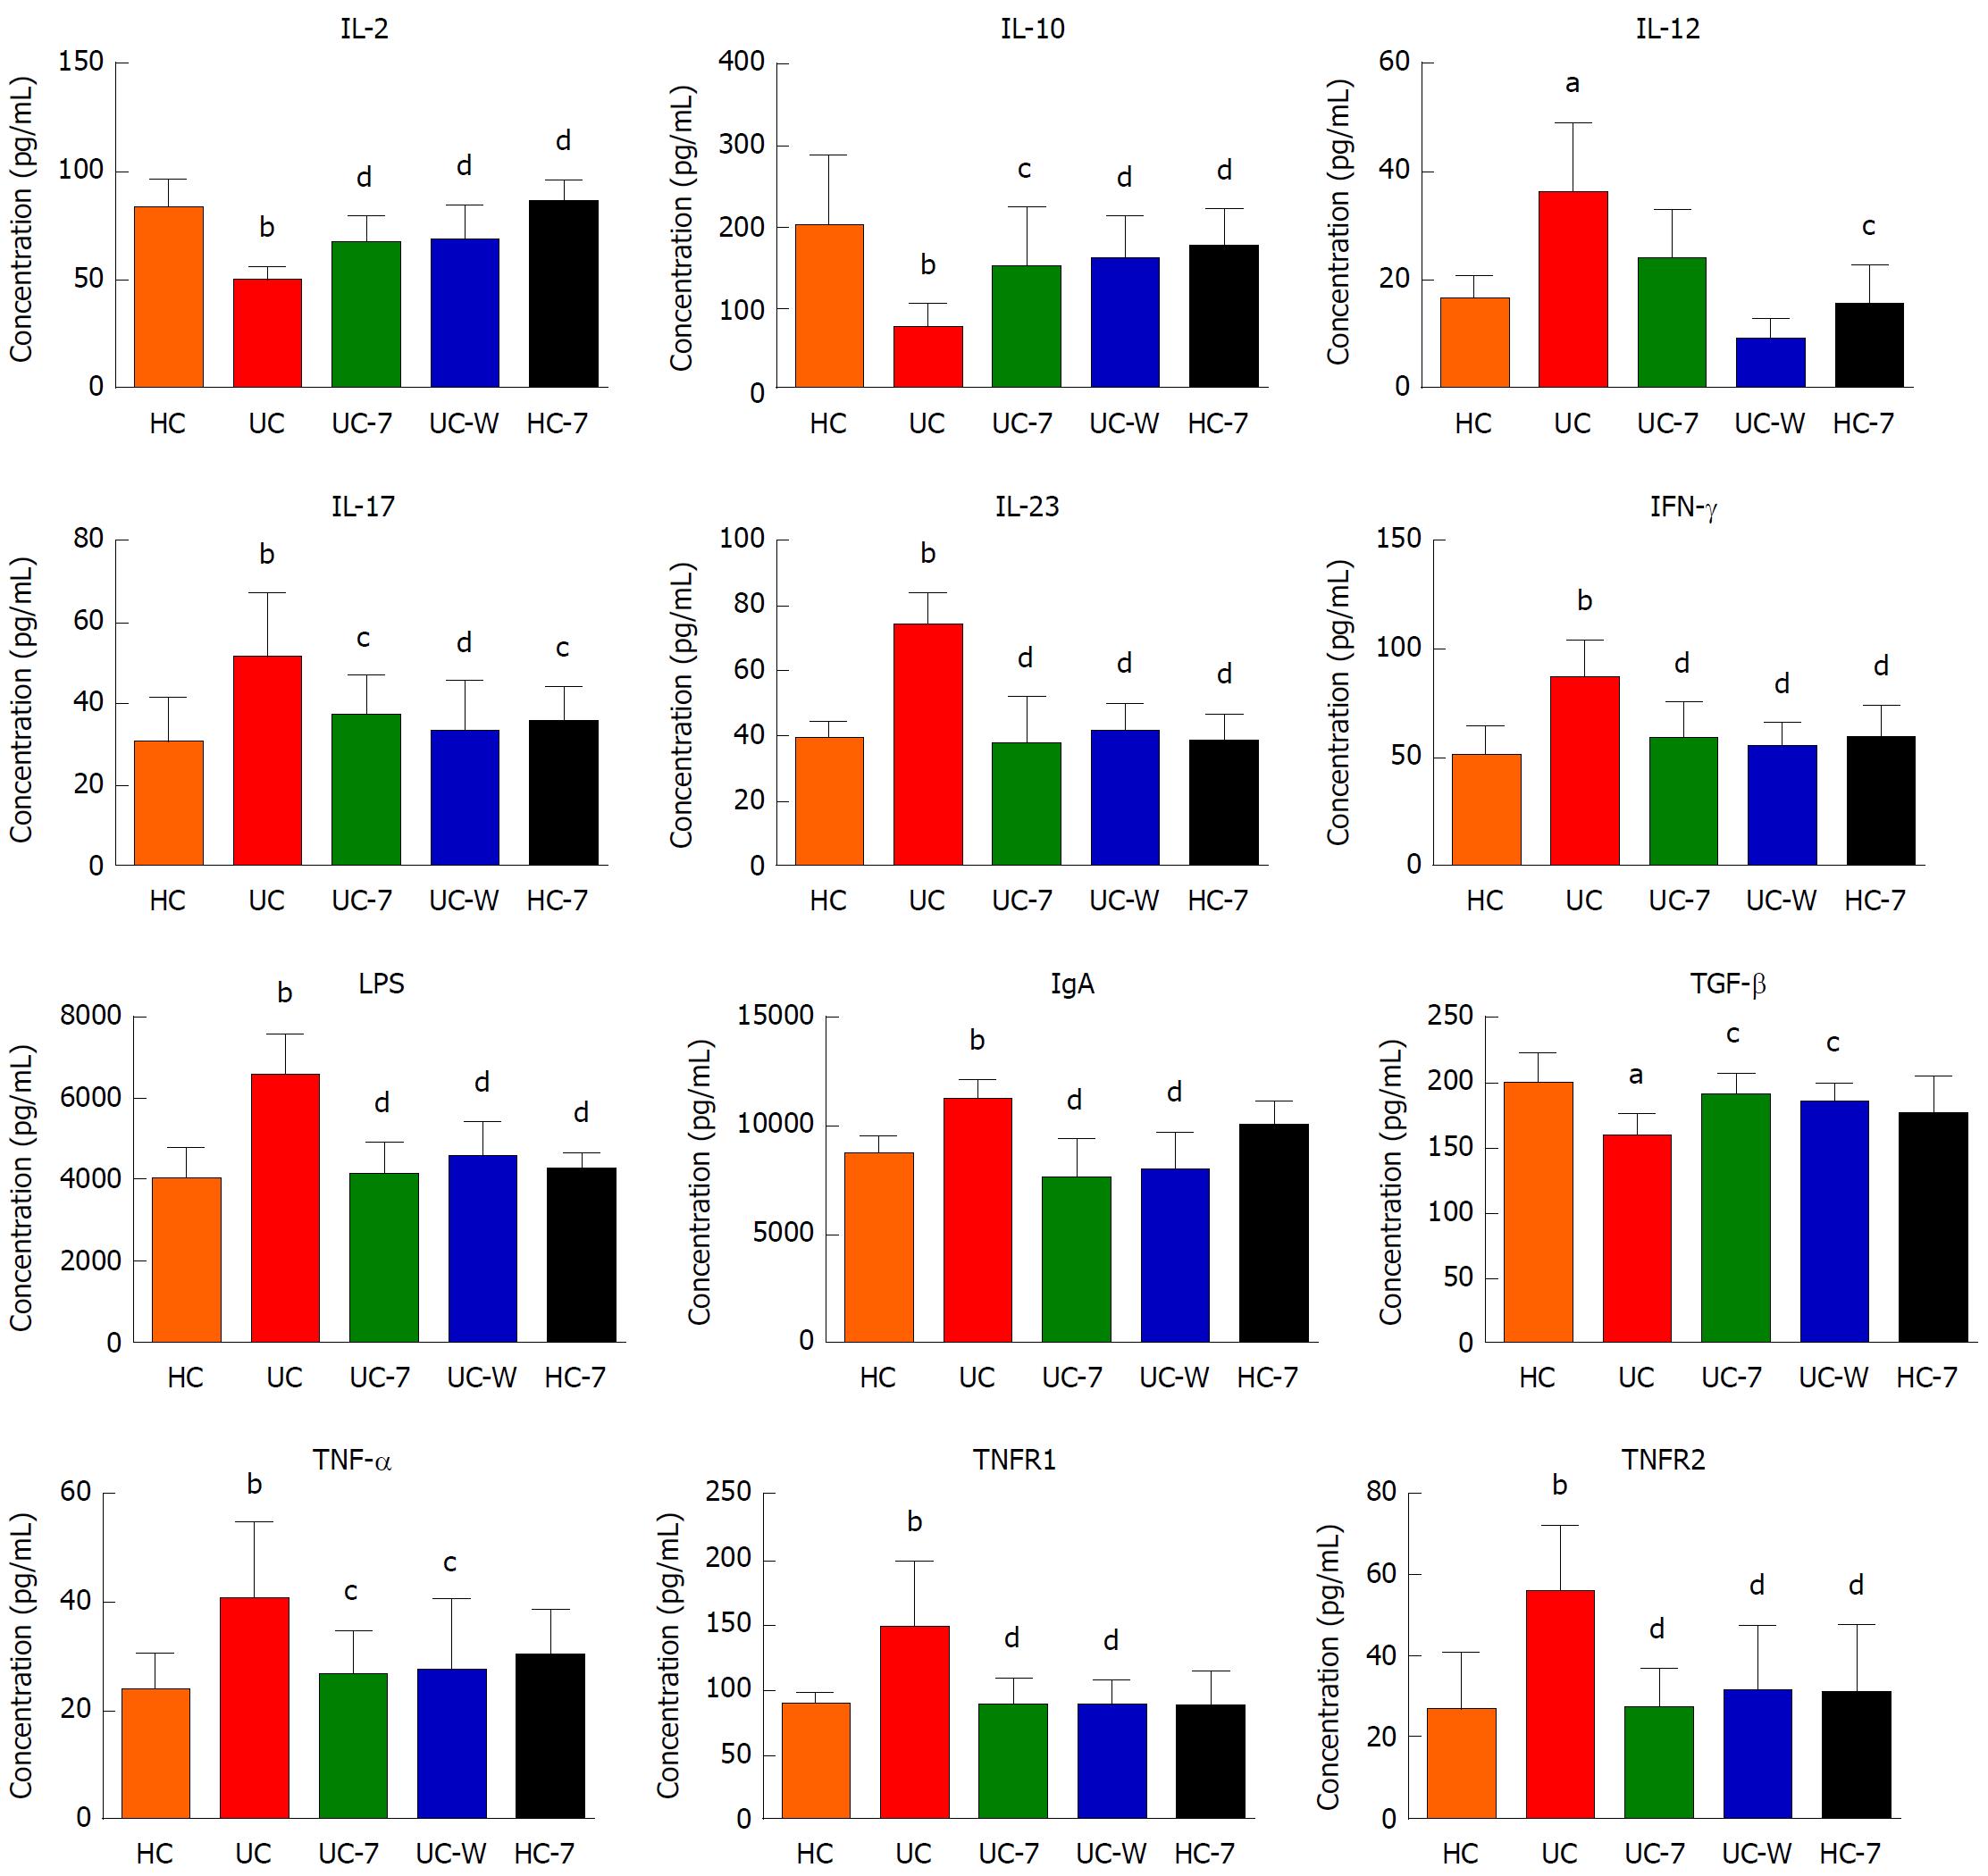
Figure 10 The levels of IL-2, IL-10, IL-12, IL-17, IL-23, IFN-γ, LPS, IgA, TGF-β, TNF-α, TNFR1 and TNFR2 in serum.
HC: Healthy controls; UC: UC model group; UC-7: UC model with seven days of moxibustion; UC-W: UC model with mesalazine gavage; HC-7: Healthy controls with seven days of moxibustion. IL-2, IL-10 (P < 0.01) and TGF-β (P < 0.05) were lower and IL-12 (P < 0.05), IL-17, IL-23, IFN-γ, LPS, IgA, TNF-α, TNFR1 and TNFR2 (P < 0.01) were higher in the UC group compared with the HC group. The levels of IL-2 (P < 0.01), IL-10 (UC-7, P < 0.05, UC-W and HC-7, P < 0.01) and TGF-β (UC-7 and UC-W, P < 0.05, HC-7, P > 0.05) were higher in the treatment groups than the UC group. The levels of IL-17 (UC-7 and HC-7, P < 0.05, UC-W, P < 0.01), IL-23, IFN-γ, LPS, IgA, TNFR1, TNFR2 (P < 0.01), and TNF-α (P < 0.05) in serum were lower in the UC-7 and UC-W groups. However, there were no significant differences in the level of IL-12 between the UC group and the UC-7 group and between the UC group and the UC-W group (P > 0.05). aP < 0.05, bP < 0.01 vs the HC group. cP < 0.05, dP < 0.01 vs the UC group.
- Citation: Qi Q, Liu YN, Jin XM, Zhang LS, Wang C, Bao CH, Liu HR, Wu HG, Wang XM. Moxibustion treatment modulates the gut microbiota and immune function in a dextran sulphate sodium-induced colitis rat model. World J Gastroenterol 2018; 24(28): 3130-3144
- URL: https://www.wjgnet.com/1007-9327/full/v24/i28/3130.htm
- DOI: https://dx.doi.org/10.3748/wjg.v24.i28.3130


