Copyright
©The Author(s) 2018.
World J Gastroenterol. Jul 28, 2018; 24(28): 3130-3144
Published online Jul 28, 2018. doi: 10.3748/wjg.v24.i28.3130
Published online Jul 28, 2018. doi: 10.3748/wjg.v24.i28.3130
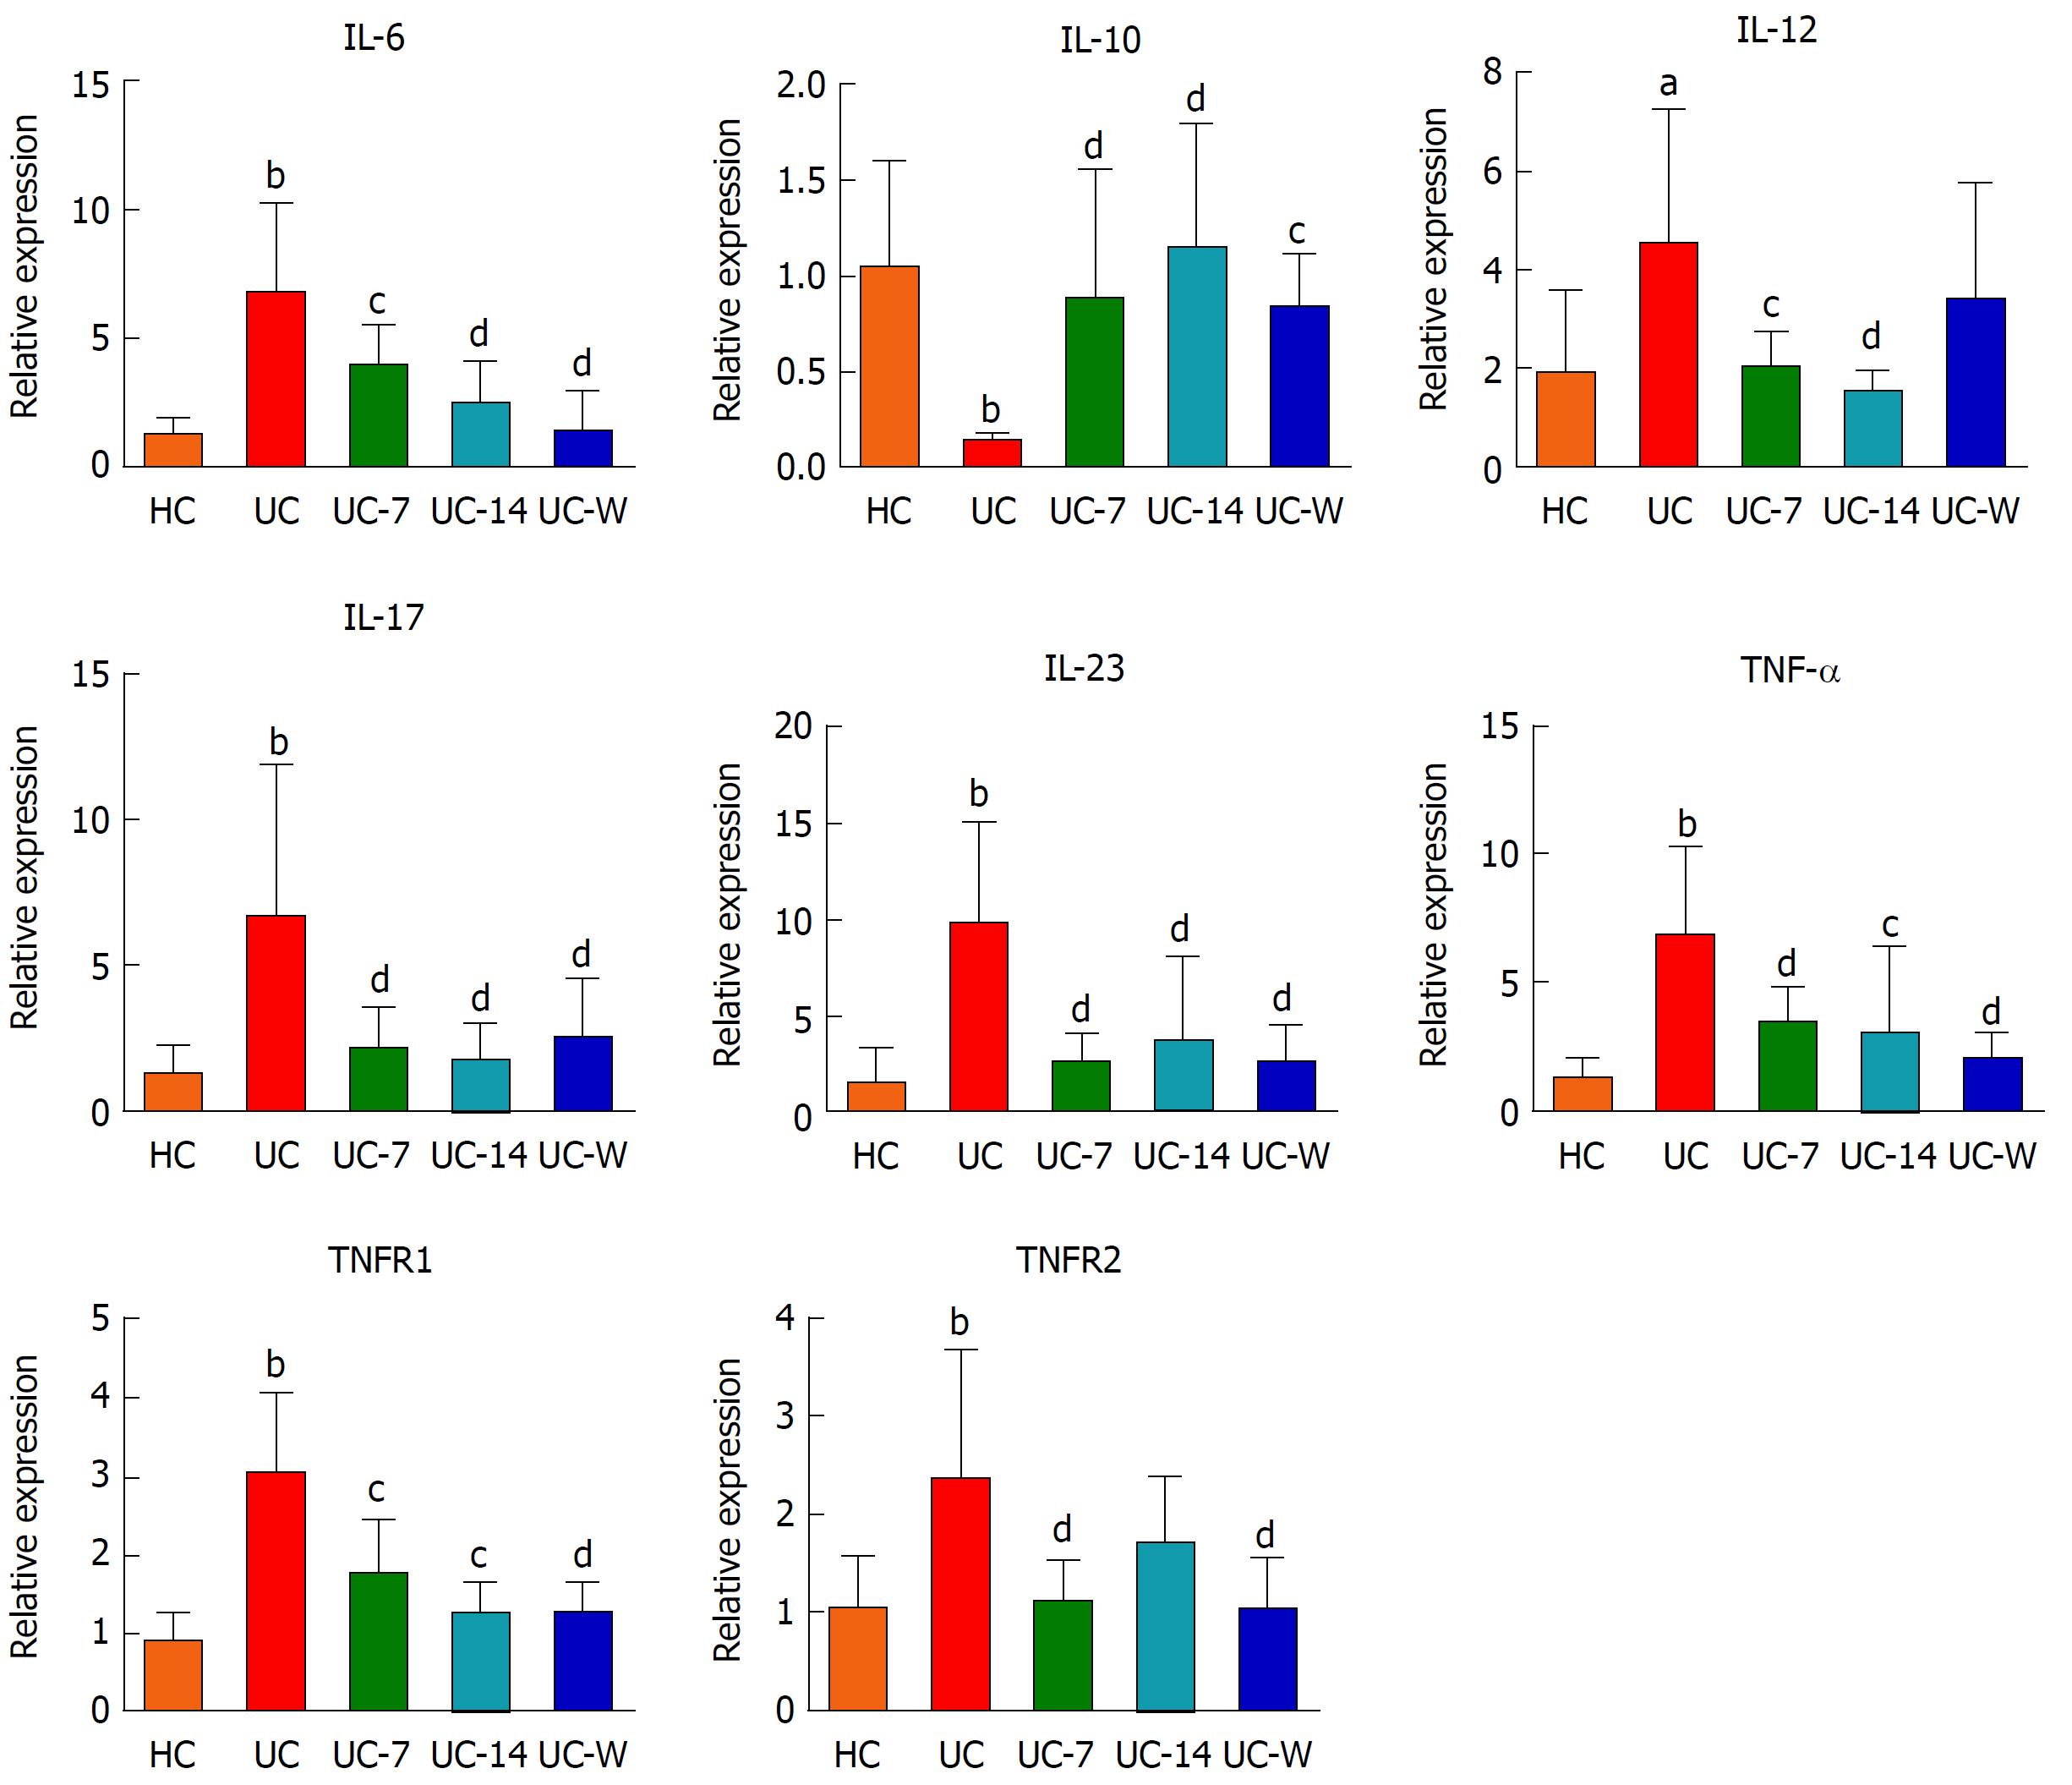
Figure 9 The relative expression levels of IL-6, IL-10, IL-12, IL-17, IL-23, TNF-α, TNFR1 and TNFR2 in colon mucosa.
HC: Healthy controls; UC: UC model group; UC-7: UC model with seven days of moxibustion; UC-14: UC model with fourteen days of moxibustion; UC-W: UC model with mesalazine gavage. The relative expression levels of IL-12 (P < 0.05), IL-6, IL-17, IL-23, TNF-α, TNFR1 and TNFR2 (P < 0.01) in the UC group were increased compared with the HC group. IL-10 (P < 0.01) expression levels in the UC group were decreased compared with the HC group. IL-17, IL-23, TNF-α, TNFR2 (P < 0.01), IL-6, IL-12, and TNFR1 (P < 0.05) expression levels were decreased in the UC-7 group compared with the UC group. TNF-α, TNFR1 (P < 0.05), IL-12, IL-6, IL-17, and IL-23 (P < 0.01) expression levels in the UC-14 group were decreased compared with UC rats. IL-10 was higher in the UC-7 group (P < 0.01), the UC-14 group (P < 0.01), and the UC-W group (P < 0.05) compared to the UC group. IL-6, IL-17, IL-23, TNF-α, TNFR1, and TNFR2 (P < 0.01) expression levels were decreased in the UC-W group compared with the UC group. aP < 0.05, bP < 0.01 vs the HC group; cP < 0.05, dP < 0.01 vs the UC group.
- Citation: Qi Q, Liu YN, Jin XM, Zhang LS, Wang C, Bao CH, Liu HR, Wu HG, Wang XM. Moxibustion treatment modulates the gut microbiota and immune function in a dextran sulphate sodium-induced colitis rat model. World J Gastroenterol 2018; 24(28): 3130-3144
- URL: https://www.wjgnet.com/1007-9327/full/v24/i28/3130.htm
- DOI: https://dx.doi.org/10.3748/wjg.v24.i28.3130


