Copyright
©The Author(s) 2018.
World J Gastroenterol. Jan 14, 2018; 24(2): 297-302
Published online Jan 14, 2018. doi: 10.3748/wjg.v24.i2.297
Published online Jan 14, 2018. doi: 10.3748/wjg.v24.i2.297
Figure 1 Findings from computed tomography.
A: Unenhanced computed tomography (CT) image shows a slight low attenuating lesion (arrow) in pancreatic uncinated process and head and dilatation of gallbladder; B: Contrast-enhanced arterial phase CT image shows minimal enhancing low attenuating lesion (long arrow) surrounding a few tubular low cystic attenuating structures (short arrow), and homogenous highly enhancing normal pancreas (arrowhead); C: Contrast-enhanced portal venous phase CT image shows delayed enhancing lesion (long arrow) containing a few tubular cystic structures (short arrow).
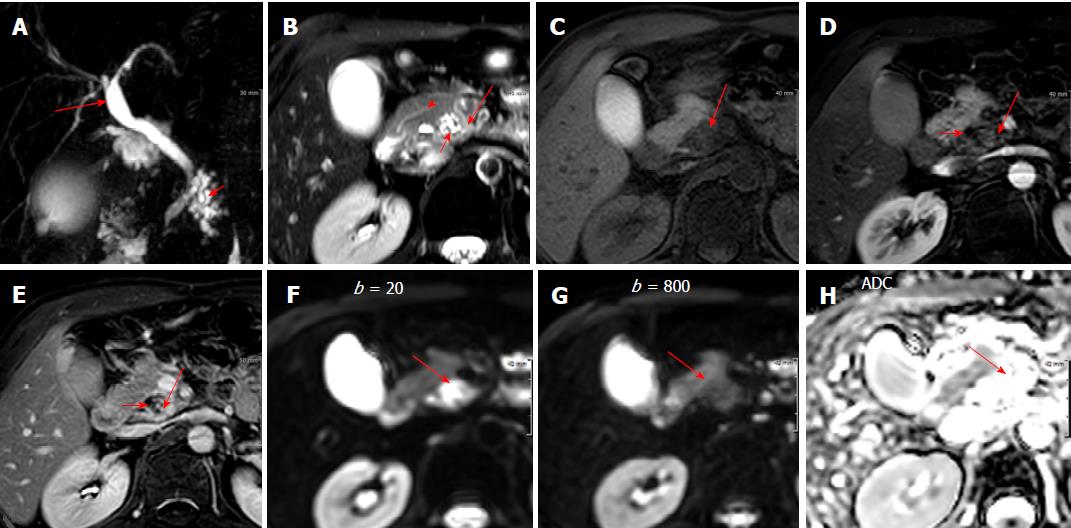
Figure 2 Findings from magnetic resonance image.
A: Magnetic resonance (MR) cholangiopancreatography shows localized branch pancreatic duct dilatation (short arrow) in head of pancreas with tapering of distal common bile duct and dilatation of proximal common duct (long arrow); B: T2-weighted MR image shows slight high signal intensity lesion (long arrow) containing bright intensity branch duct dilatation (short arrow) in head and uncinate process of pancreas, and incidental finding of pancreatic divisum (arrowhead); C: Fat-suppressed T1-weighted MR image shows a well-demarcated low signal intensity lesion (long arrow) in uncinate process and head of pancreas; D-E: Fat-suppressed T1-weighted gadolinium-enhanced arterial- (D) and delayed-phase (E) MR images show delayed highly enhancing solid mass-like lesion (long arrows) containing non-enhancing dark intensity branch duct dilatation (short arrows) in pancreatic head; F: The higher signal intensity lesion (arrow) on diffusion-weighted image obtained with b = 20 s/m2 shows as low signal intensity (arrow) on diffusion-weighted image obtained with b = 800 s/m2 and as higher (arrow) apparent diffusion coefficient (ADC) without diffusion restriction.
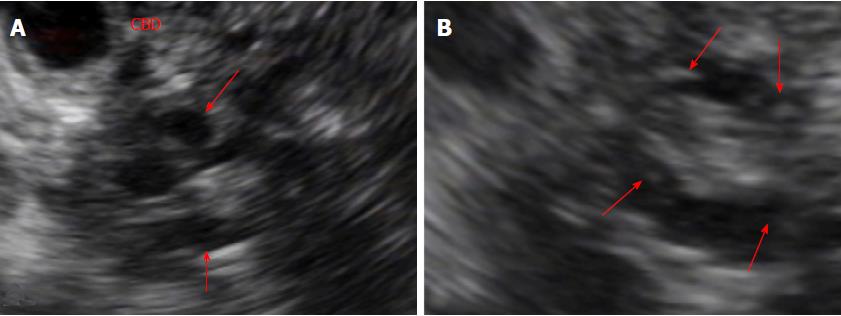
Figure 3 Findings from endoscopic ultrasound.
A: EUS shows a few anechoic tubular structures (arrows), causing indentation of distal CBD and dilatation of proximal bile duct; B: EUS shows small hyperechoic mural nodules (arrows) in the dilated branch pancreatic ducts. EUS: Endoscopic ultrasound; CBD: Common bile duct.
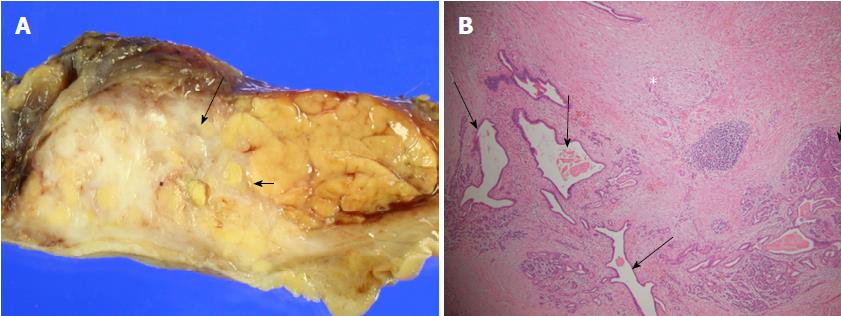
Figure 4 Macroscopic and microscopic findings of resected specimen.
A: Gross specimen shows whitish hard infiltrating mass-like lesion (arrows) focally replaced head and uncinate process of pancreas; B: Microscopy (hematoxylin and eosin, x 40) shows perilobular and intralobular fibrosis (asterisk) replaces normal pancreatic acini with focal perivascular lymphocyte infiltration (short arrow) and dilated branch ducts (long arrows).
- Citation: Jee KN. Mass forming chronic pancreatitis mimicking pancreatic cystic neoplasm: A case report. World J Gastroenterol 2018; 24(2): 297-302
- URL: https://www.wjgnet.com/1007-9327/full/v24/i2/297.htm
- DOI: https://dx.doi.org/10.3748/wjg.v24.i2.297


