Copyright
©The Author(s) 2018.
World J Gastroenterol. Apr 28, 2018; 24(16): 1766-1778
Published online Apr 28, 2018. doi: 10.3748/wjg.v24.i16.1766
Published online Apr 28, 2018. doi: 10.3748/wjg.v24.i16.1766
Figure 1 Inhibition of CRH-R2 signaling aggravates symptoms of DSS-induced colitis in mice.
A: Mice body weights measured for 16 d, and shown as percentage of weight change; B: Colon length; C: Representative photographs of colon lengths; D: DAI; E: Histological scores were evaluated on the 16th day; F: Representative images of hematoxylin-eosin staining histology. Data are presented as mean ± standard deviation, n = 6-10 per group, scale bar = 200 μm. aP < 0.001 vs control group; gP < 0.05, bP < 0.001 vs DSS group; cP < 0.001 vs Ucn2 group; hP < 0.05 vs TXYF-L group; fP < 0.01, dP < 0.001 vs TXYF-M group; iP < 0.05, eP < 0.001 vs TXYF-H group. CRH-R2: Corticotropin-releasing hormone-receptor 2; DAI: Disease activity index; DSS: Dextran sulfate sodium; TXYF: Tong-Xie-Yao-Fang.
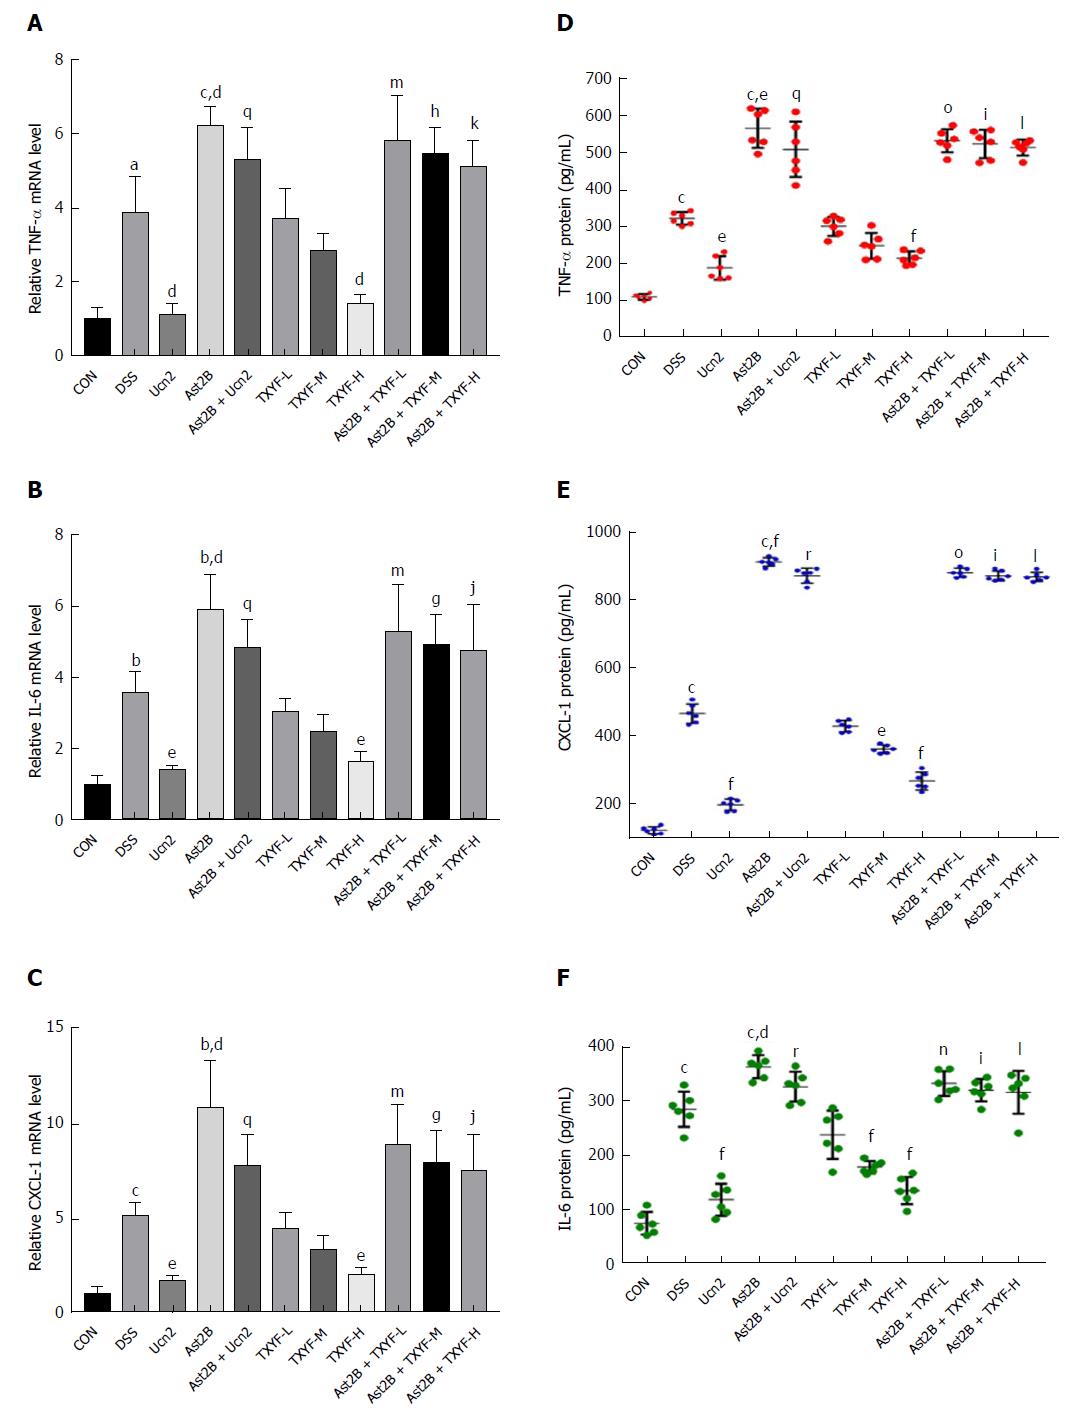
Figure 2 Inhibition of CRH-R2 signaling increases secretion of inflammatory cytokines in colon tissues of DSS-induced ulcerative colitis mice.
A-C: Real time-PCR-assessed mRNA level of TNF α (A), CXCL-1 (B) and IL 6 (C) in colon tissues. The mRNA level in each group was determined relative to the level in the control group (defined as 100%); E-F: Enzyme-linked immunosorbent assay-detected protein levels of TNF α (D), CXCL-1 (E) and IL 6 (F) in colon tissues. Data are presented as mean ± standard deviation, n = 6 per group. bP < 0.01, cP < 0.001 vs control group; dP < 0.05, eP < 0.01, fP < 0.001 vs DSS group; qP < 0.01, rP < 0.001 vs Ucn2 group; mP < 0.05, nP < 0.01, oP < 0.001 vs TXYF-L group; gP < 0.05, hP < 0.01, iP < 0.001 vs TXYF-M group; jP < 0.05, kP < 0.01, lP < 0.001 vs TXYF-H group. CRH-R2: Corticotropin-releasing hormone-receptor 2; DSS: Dextran sulfate sodium; TXYF: Tong-Xie-Yao-Fang.
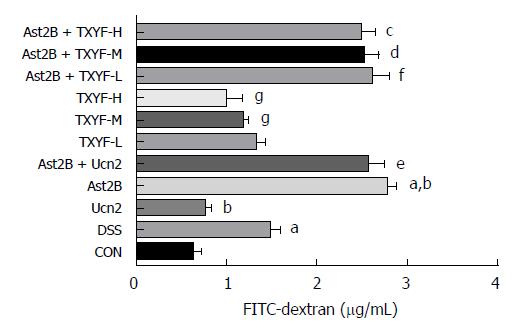
Figure 3 Inhibition of CRH-R2 signaling promotes intestinal permeability in DSS-induced colitis.
The FITC-dextran levels in serum were determined. Data are presented as mean ± standard deviation, n = 6 per group. aP < 0.001 vs control group; gP < 0.05, bP < 0.001 vs DSS group; eP < 0.001 vs Ucn2 group; fP < 0.001 vs TXYF-L group; dP < 0.001 vs TXYF-M group; cP < 0.001 vs TXYF-H group. CRH-R2: Corticotropin-releasing hormone-receptor 2; DSS: Dextran sulfate sodium; TXYF: Tong-Xie-Yao-Fang.
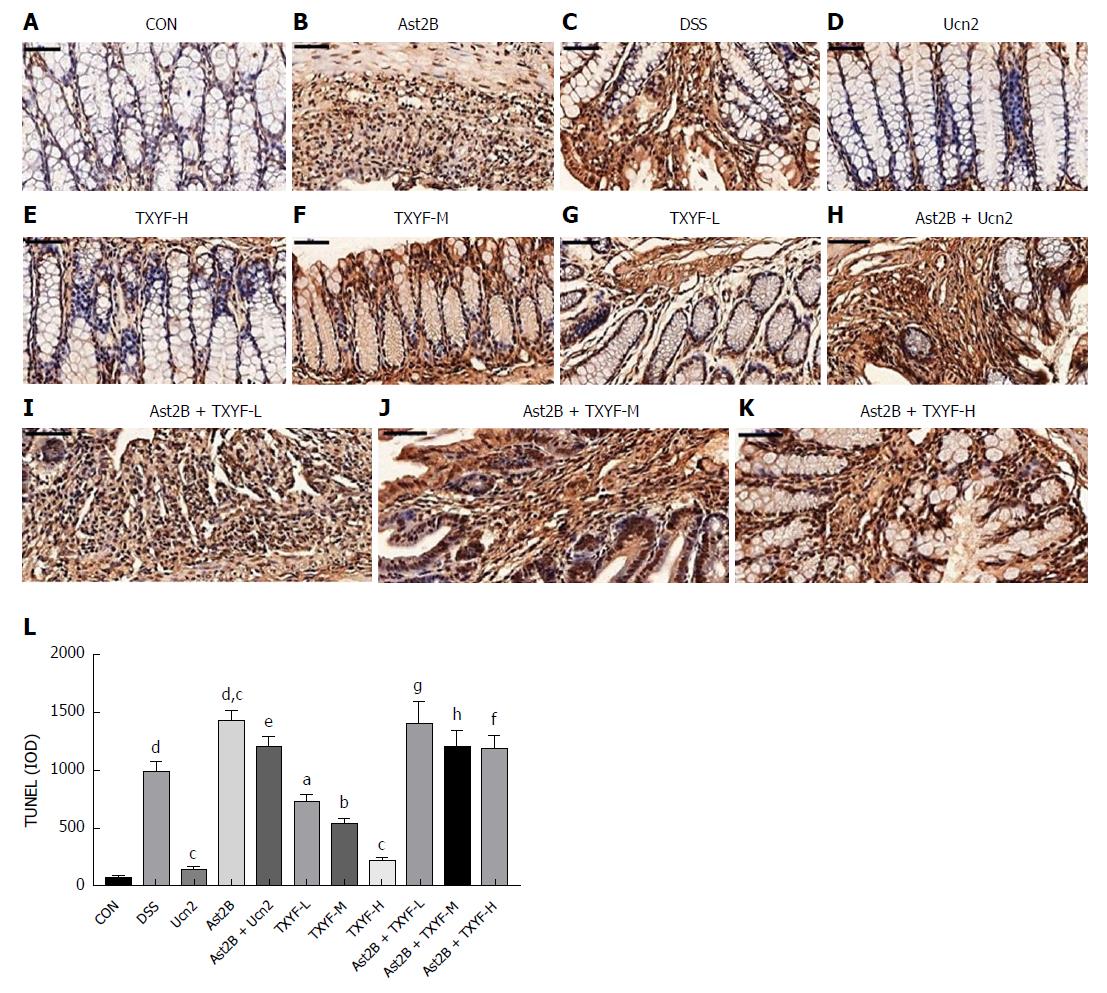
Figure 4 Inhibition of CRH-R2 signaling promotes colonic epithelial cell apoptosis in DSS-induced colitis.
A-K: Representative images from TUNEL sections; L: Quantification of TUNEL data. Data are presented as mean ± standard deviation, n = 6 per group, scale bar = 50 μm. dP < 0.001 vs control group; aP < 0.05, bP < 0.01, cP < 0.001 vs DSS group; eP < 0.001 vs Ucn2 group; gP < 0.01 vs TXYF-L group; hP < 0.01 vs TXYF-M group; fP < 0.001 vs TXYF-H group. CRH-R2: Corticotropin-releasing hormone-receptor 2; DSS: Dextran sulfate sodium; TUNEL: Terminal deoxynucleotidyl transferase dUTP nick-end labeling; TXYF: Tong-Xie-Yao-Fang.
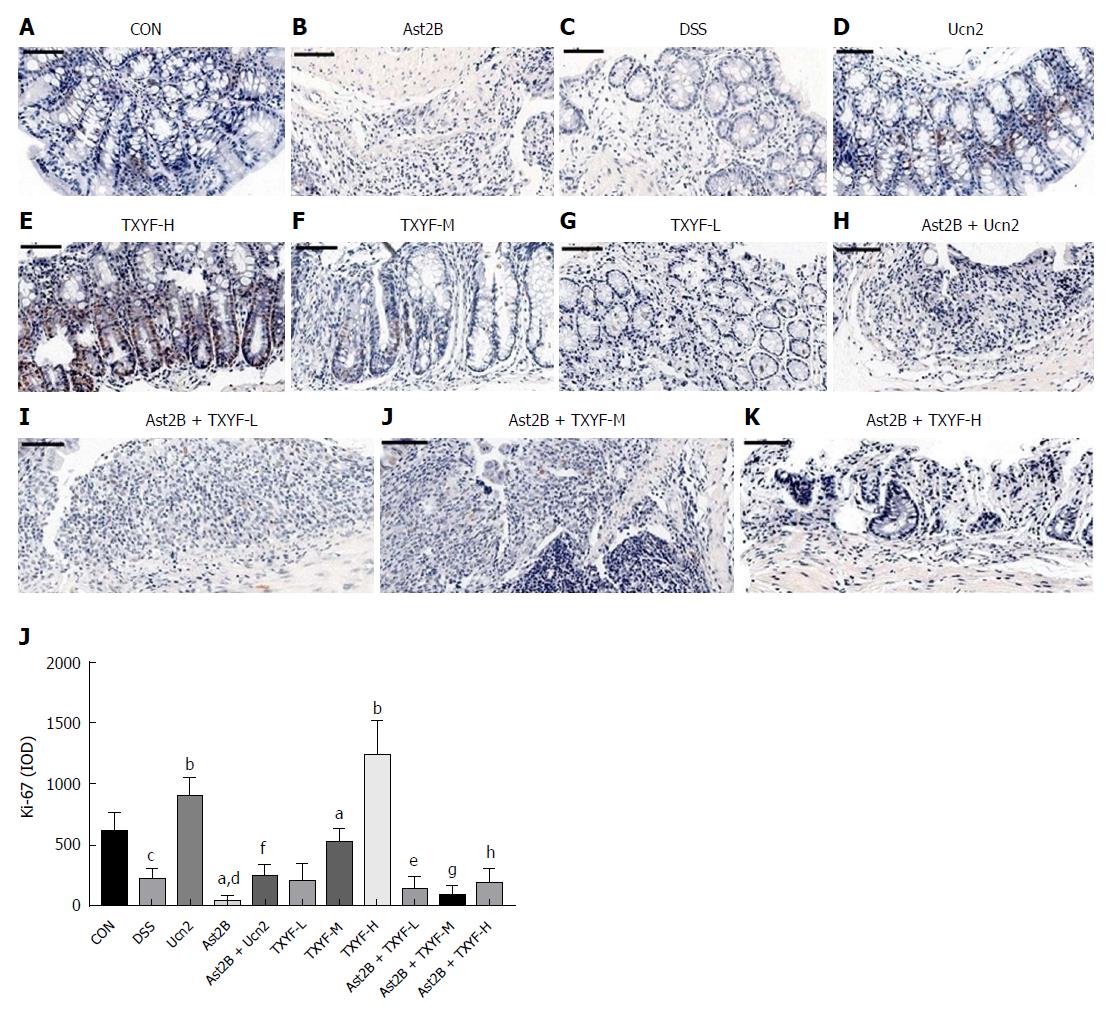
Figure 5 Inhibition of CRH-R2 signaling reduces epithelial cell proliferation in DSS-induced colitis.
A-K: Representative images from Ki-67 immunoreactive sections; L: Quantification of Ki-67 immunohistochemistry data. Data presented as mean ± standard deviation, n = 6 per group, scale bar = 50 μm. cP < 0.05, dP < 0.01 vs control group; aP < 0.05, bP < 0.01 vs DSS group. fP < 0.01 vs Ucn2 group; eP < 0.05 vs TXYF-L group; gP < 0.01 vs TXYF-M group; hP < 0.01 vs TXYF-H group. CRH-R2: Corticotropin-releasing hormone-receptor 2; DSS: Dextran sulfate sodium; TXYF: Tong-Xie-Yao-Fang.
- Citation: Gong SS, Fan YH, Wang SY, Han QQ, Lv B, Xu Y, Chen X, He YE. Mucosa repair mechanisms of Tong-Xie-Yao-Fang mediated by CRH-R2 in murine, dextran sulfate sodium-induced colitis. World J Gastroenterol 2018; 24(16): 1766-1778
- URL: https://www.wjgnet.com/1007-9327/full/v24/i16/1766.htm
- DOI: https://dx.doi.org/10.3748/wjg.v24.i16.1766


