Copyright
©The Author(s) 2018.
World J Gastroenterol. Mar 14, 2018; 24(10): 1072-1083
Published online Mar 14, 2018. doi: 10.3748/wjg.v24.i10.1072
Published online Mar 14, 2018. doi: 10.3748/wjg.v24.i10.1072
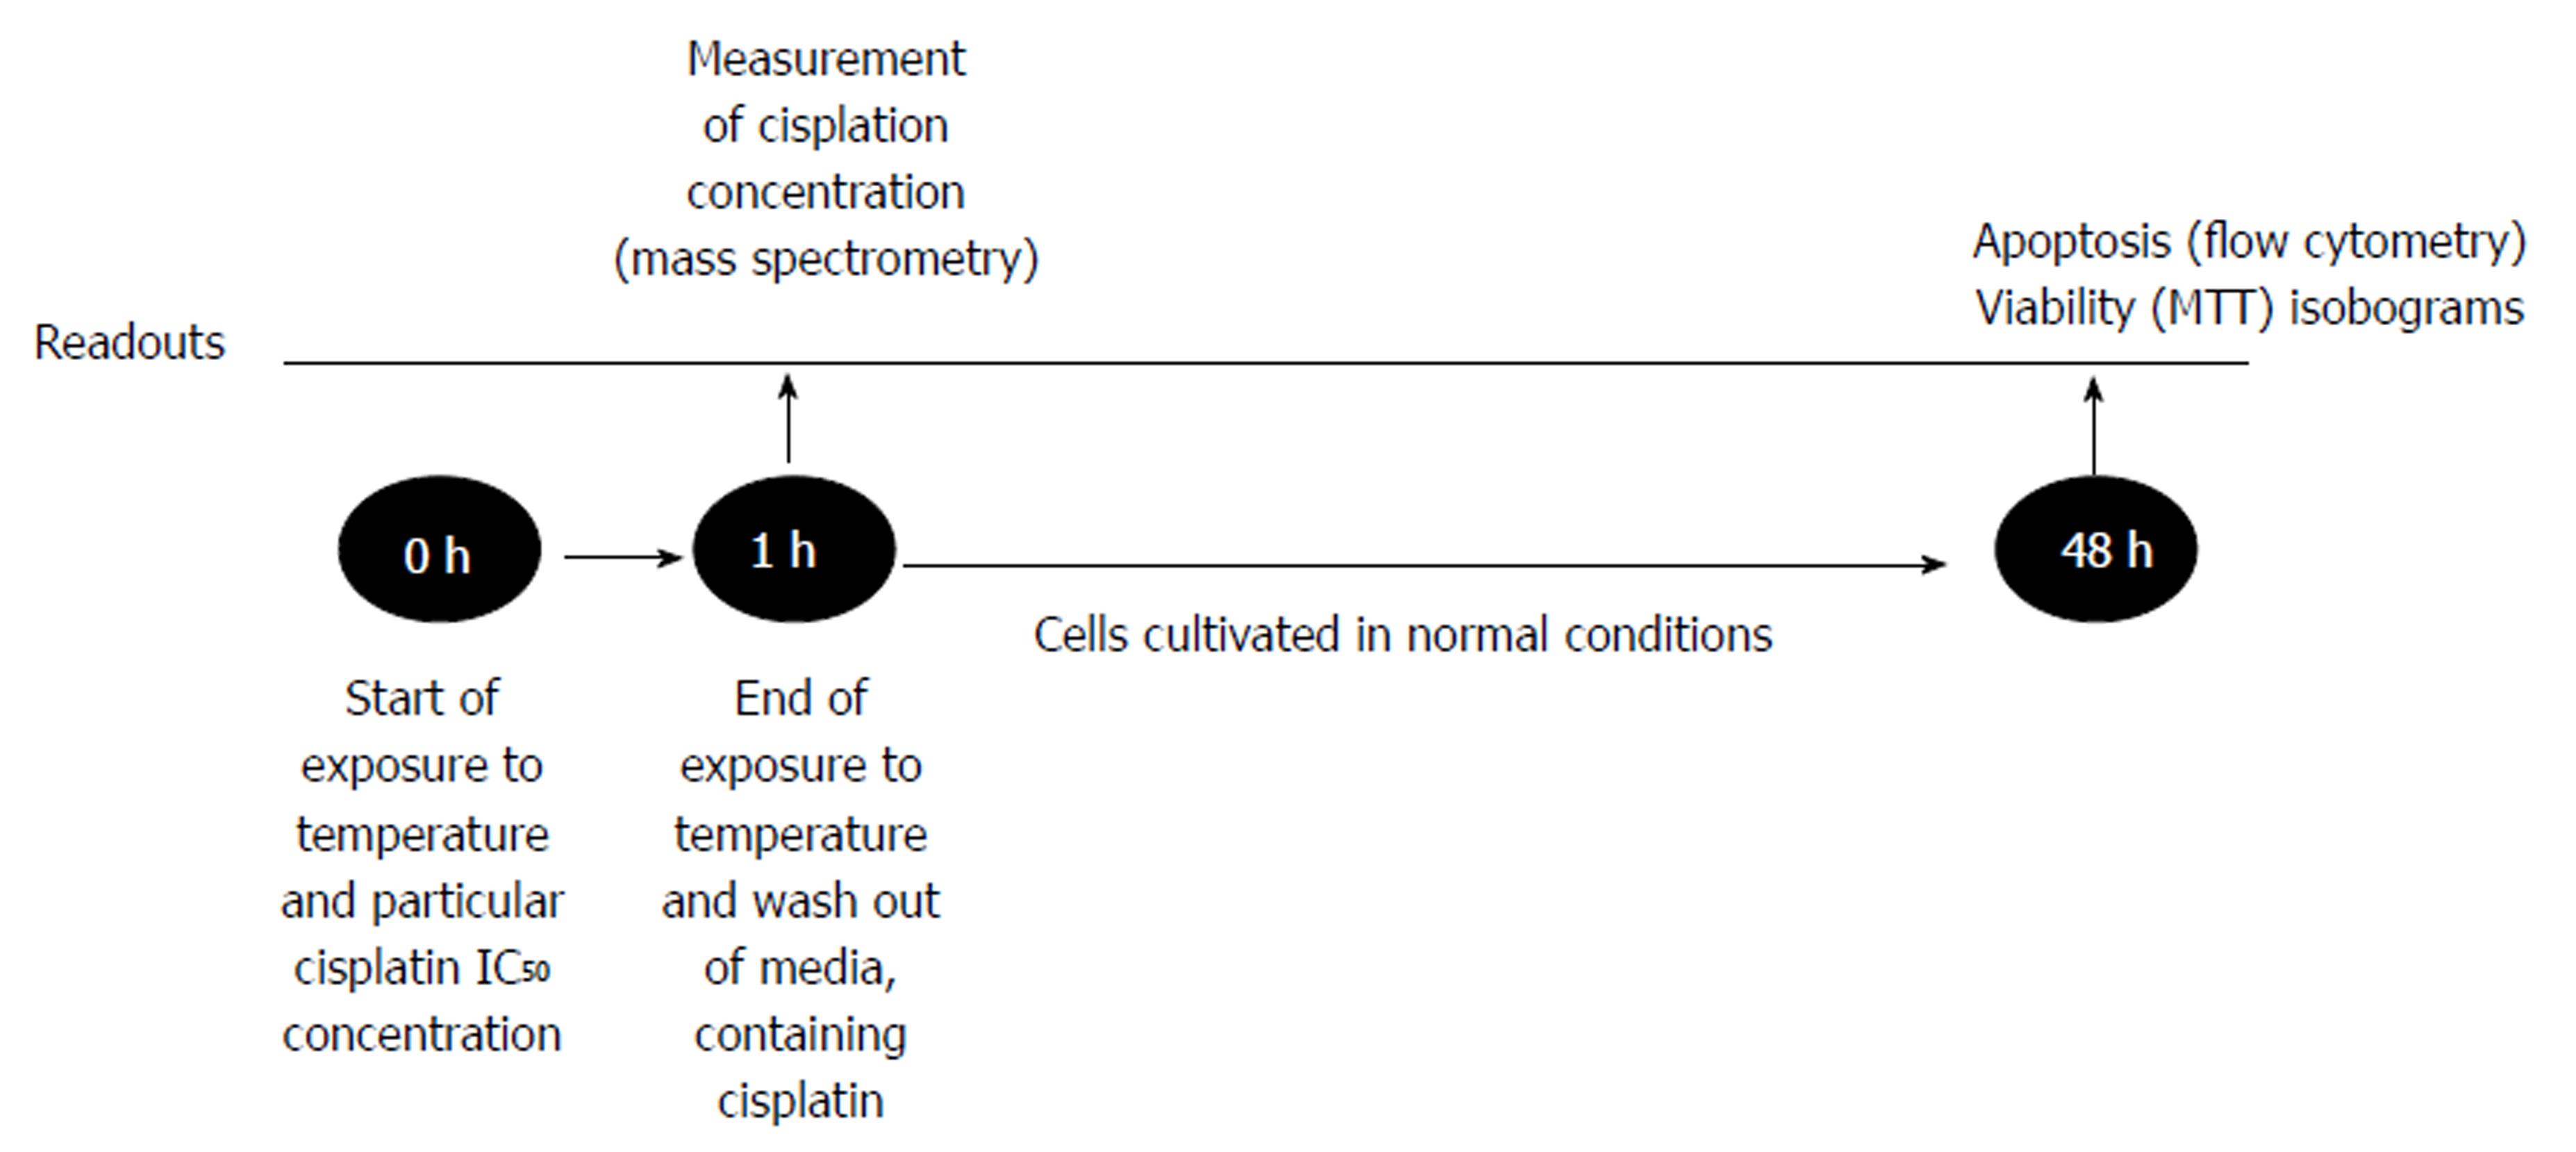
Figure 1 Design of experiment.
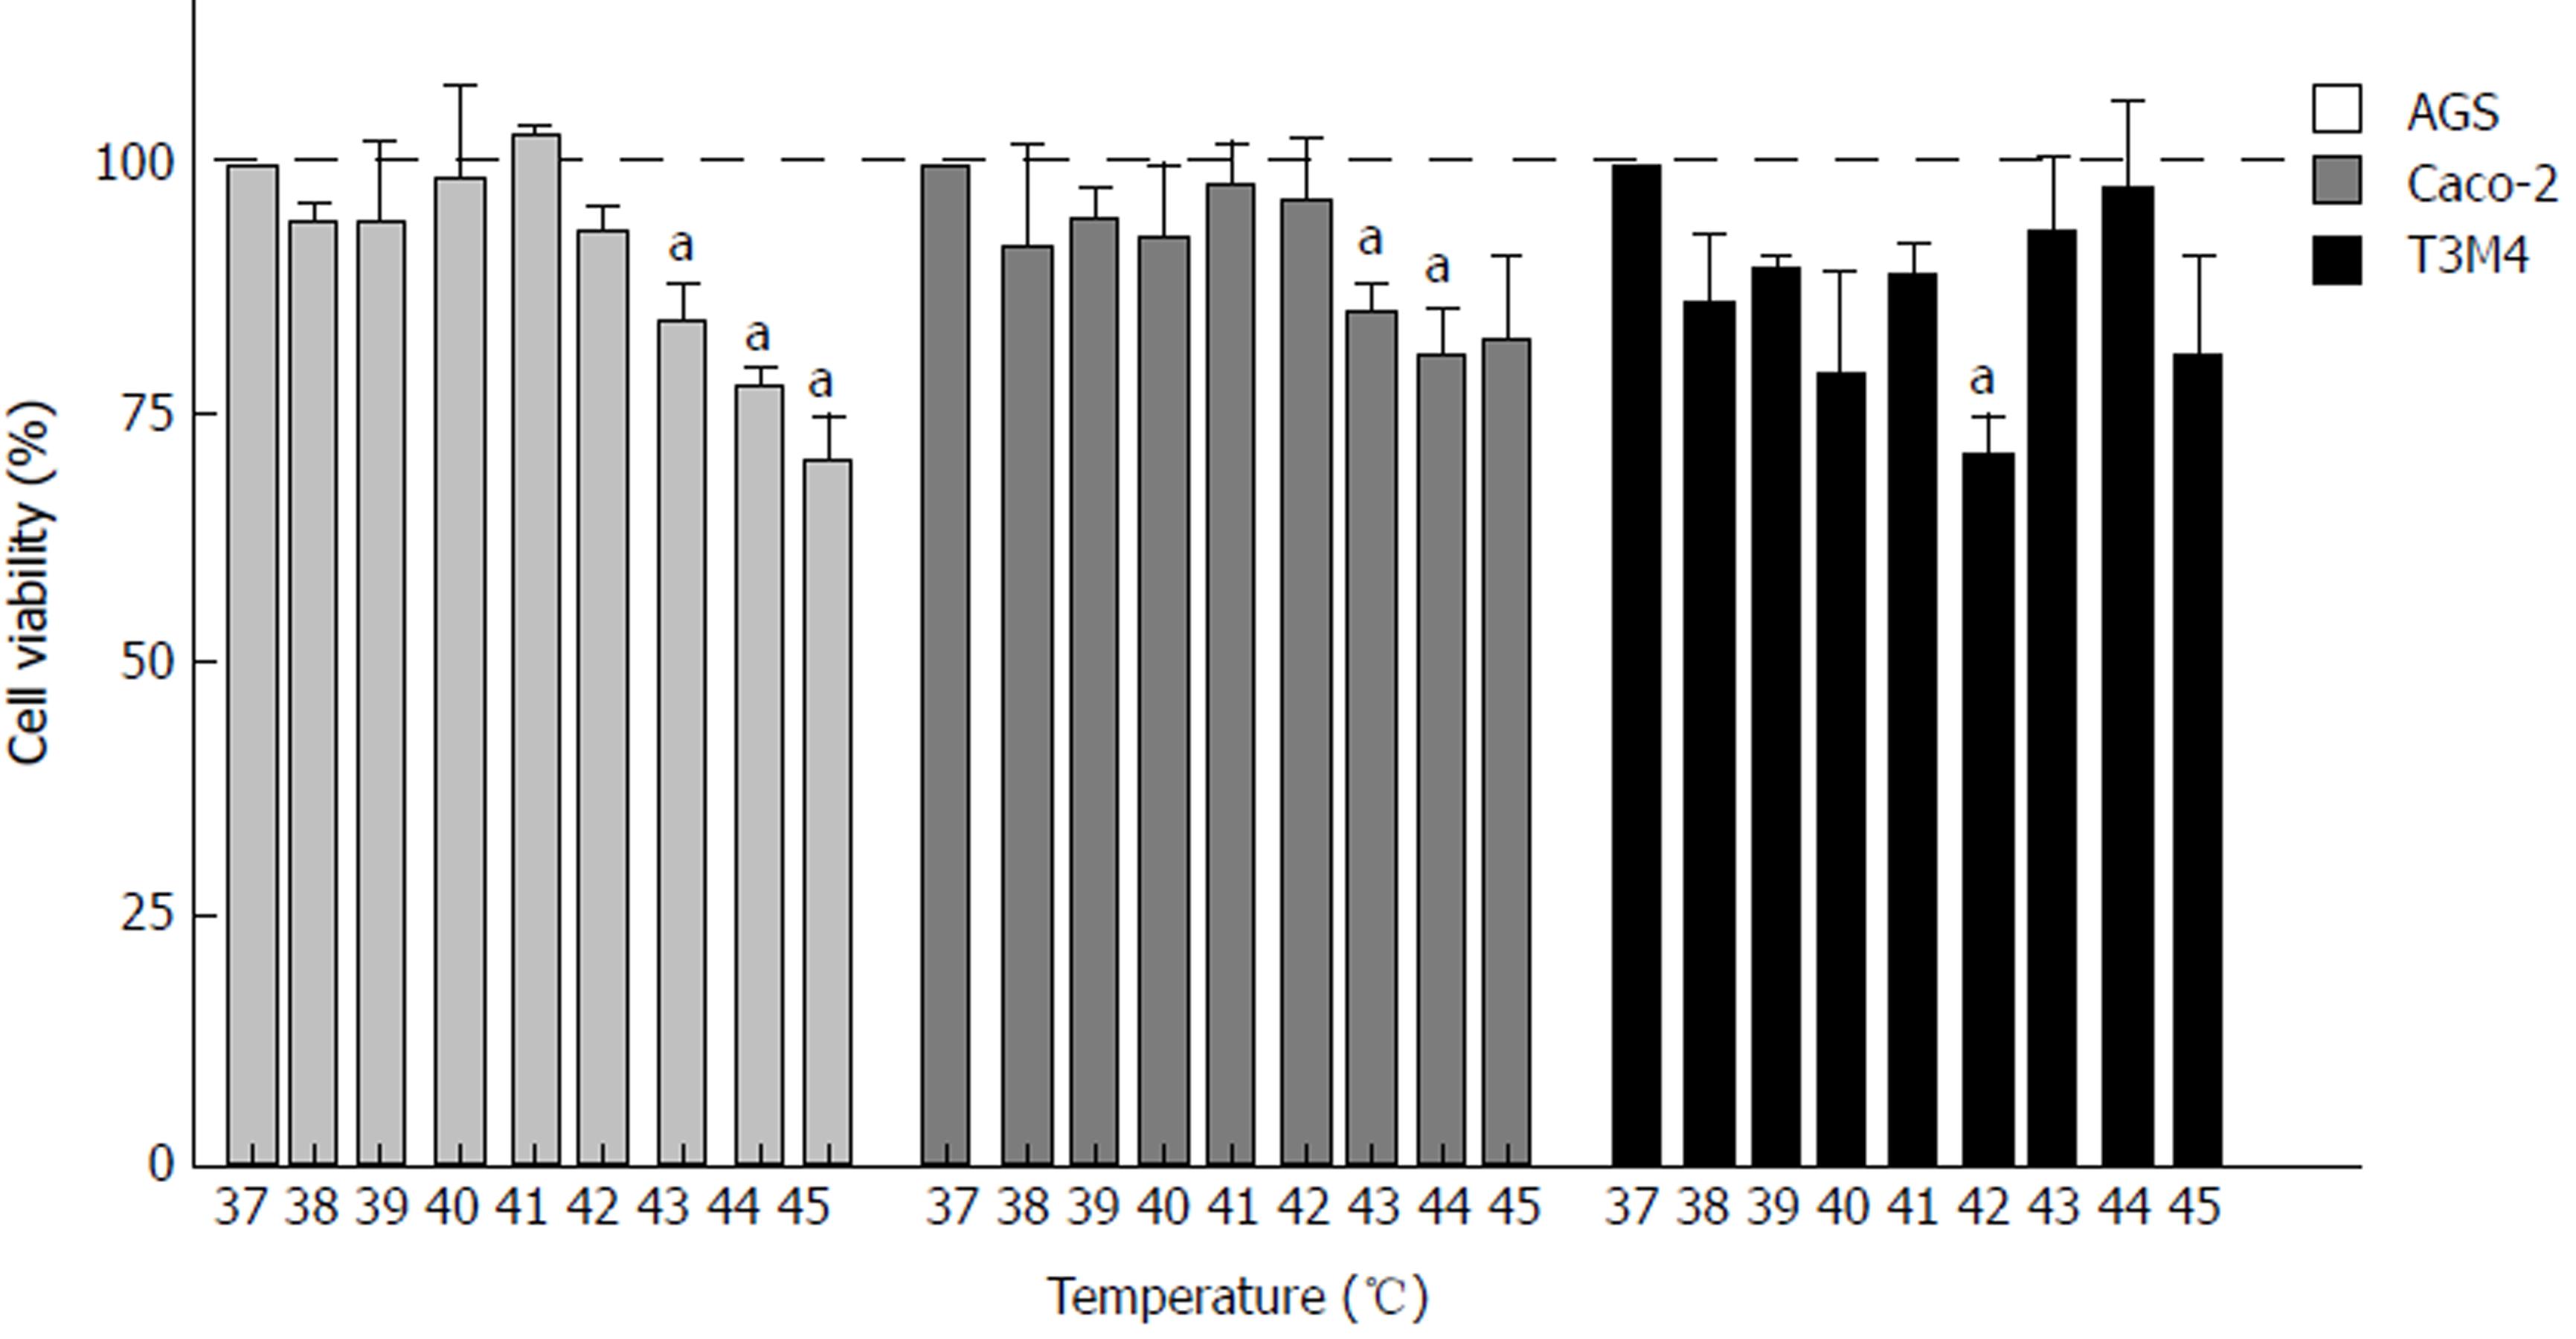
Figure 2 The different effect of the temperature on cancer cell viability.
Following a one-hour exposure of AGS, Caco-2, and T3M4 cells to temperatures ranging from 37 °C to 42 °C, there were no significant viability changes. Starting at 43 °C, viability gradually decreased in AGS and Caco-2 cells. Activation of viability was evident in T3M4 cells at temperatures of 43 °C and 44 °C. All data were compared with a control group (viability of cells at temperature of 37 °C set as 100%). Statistical analysis was performed using the Mann-Whitney U test comparing selected groups to the control. aP < 0.05 vs control.
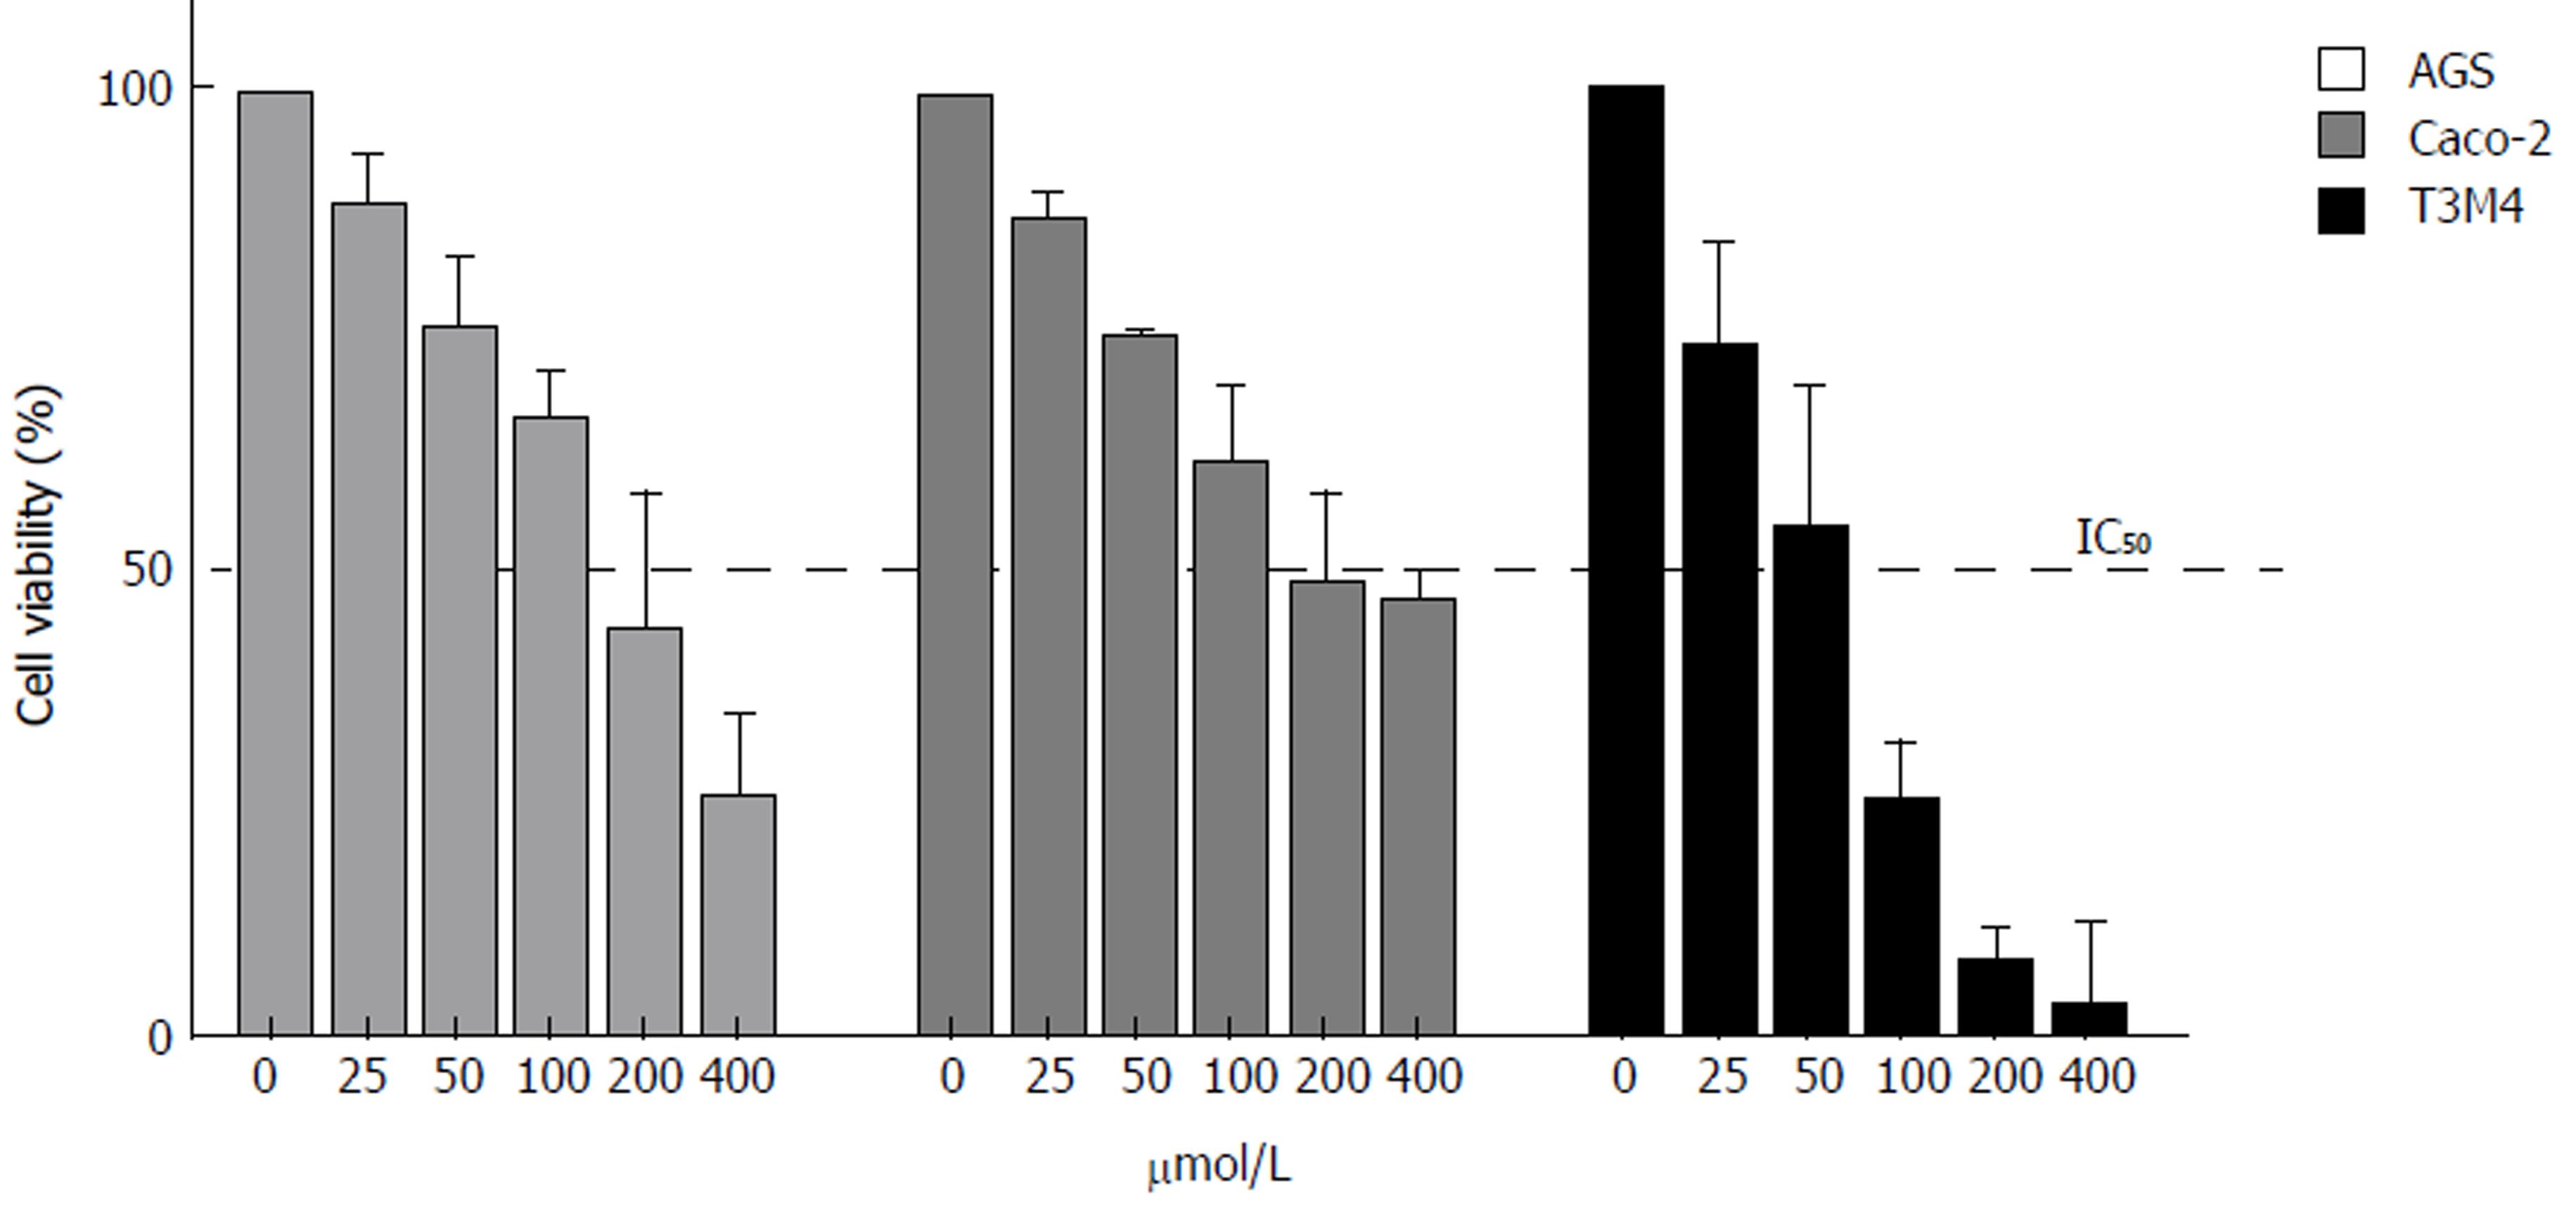
Figure 3 The influence of different cisplatin doses on cancer cell viability.
Exposure to gradually increasing doses of cisplatin resulted in a linear decrease of viability in all cancer cell lines. T3M4 cells were the most sensitive to cisplatin, followed by Caco-2 and AGS cells. All data were compared with the control group (viability of cells at 37 °C set as 100%). Data are presented as the mean ± SE from ≥ 3 replicates.
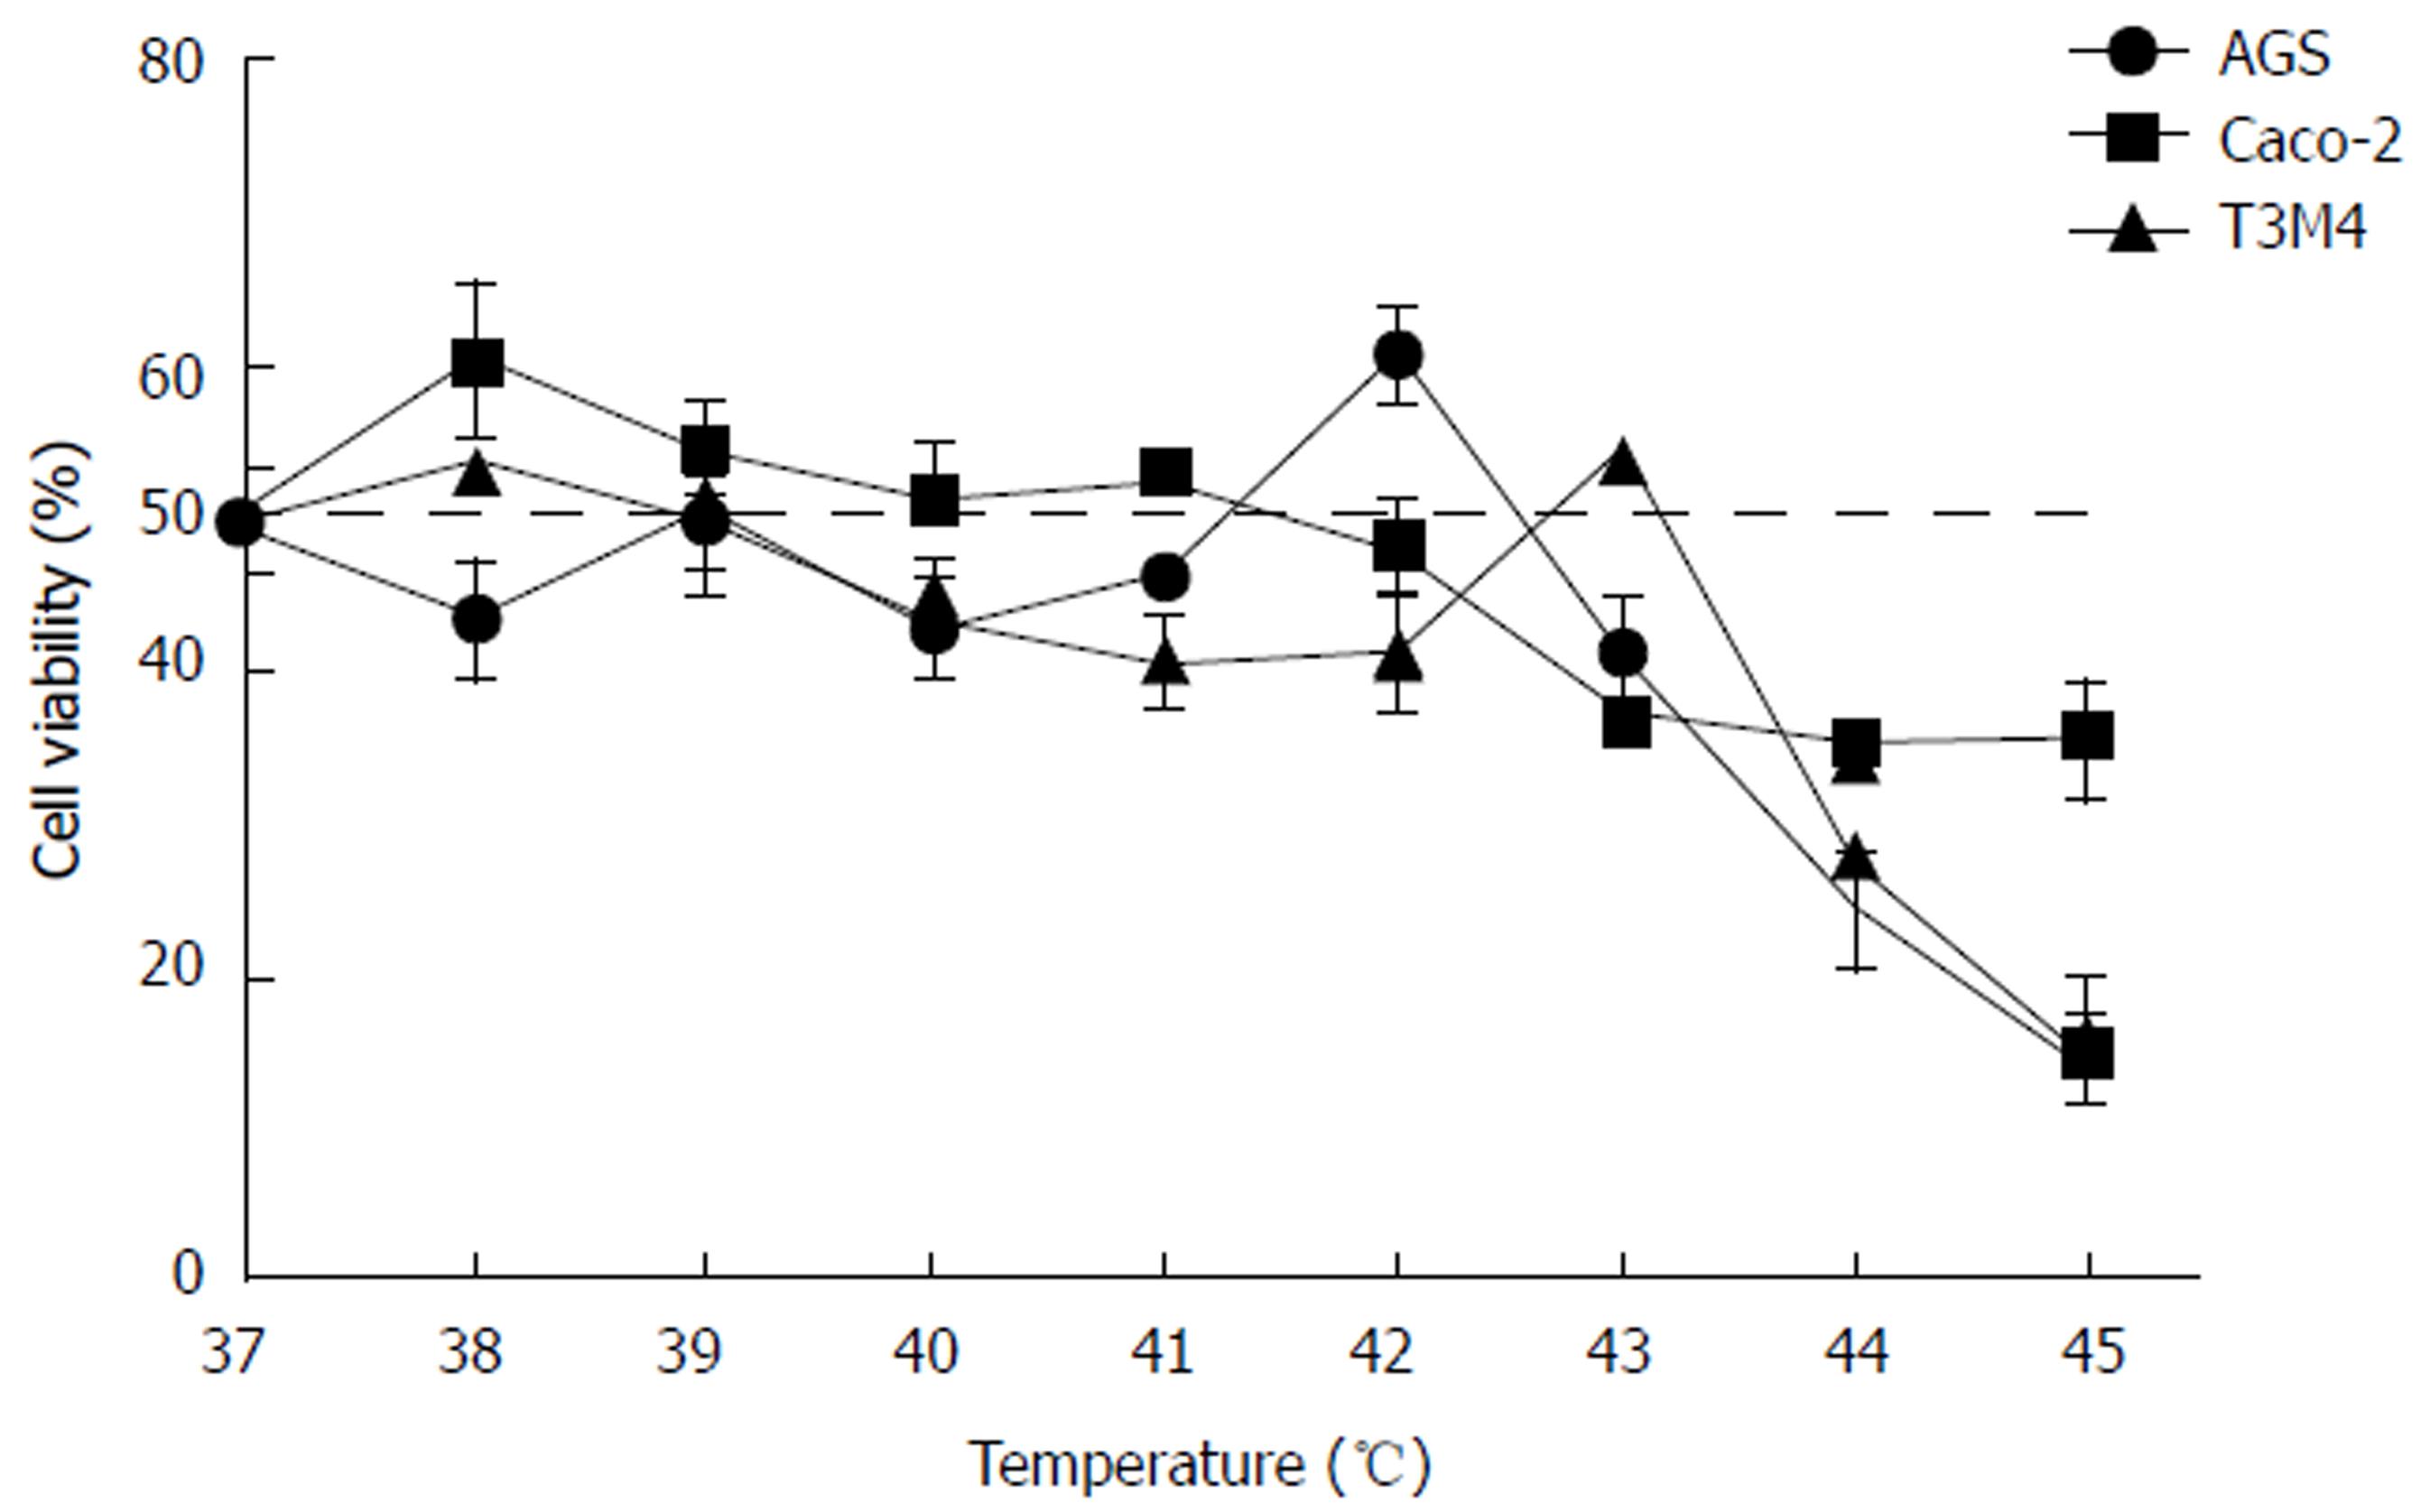
Figure 4 Effect of temperature and cisplatin (IC50) combinations on cancer cell viability.
The increase of temperature had no significant additional effect on cancer cell viability with the exception of extreme hyperthermia (44 °C-45 °C). Peaks of enhanced viability were observed in AGS and T3M4 cells at temperatures of 42 °C and 43 °C. Data are equalized to control (untreated cells) as 100% and shown in percentages. Dashed line shows IC50.
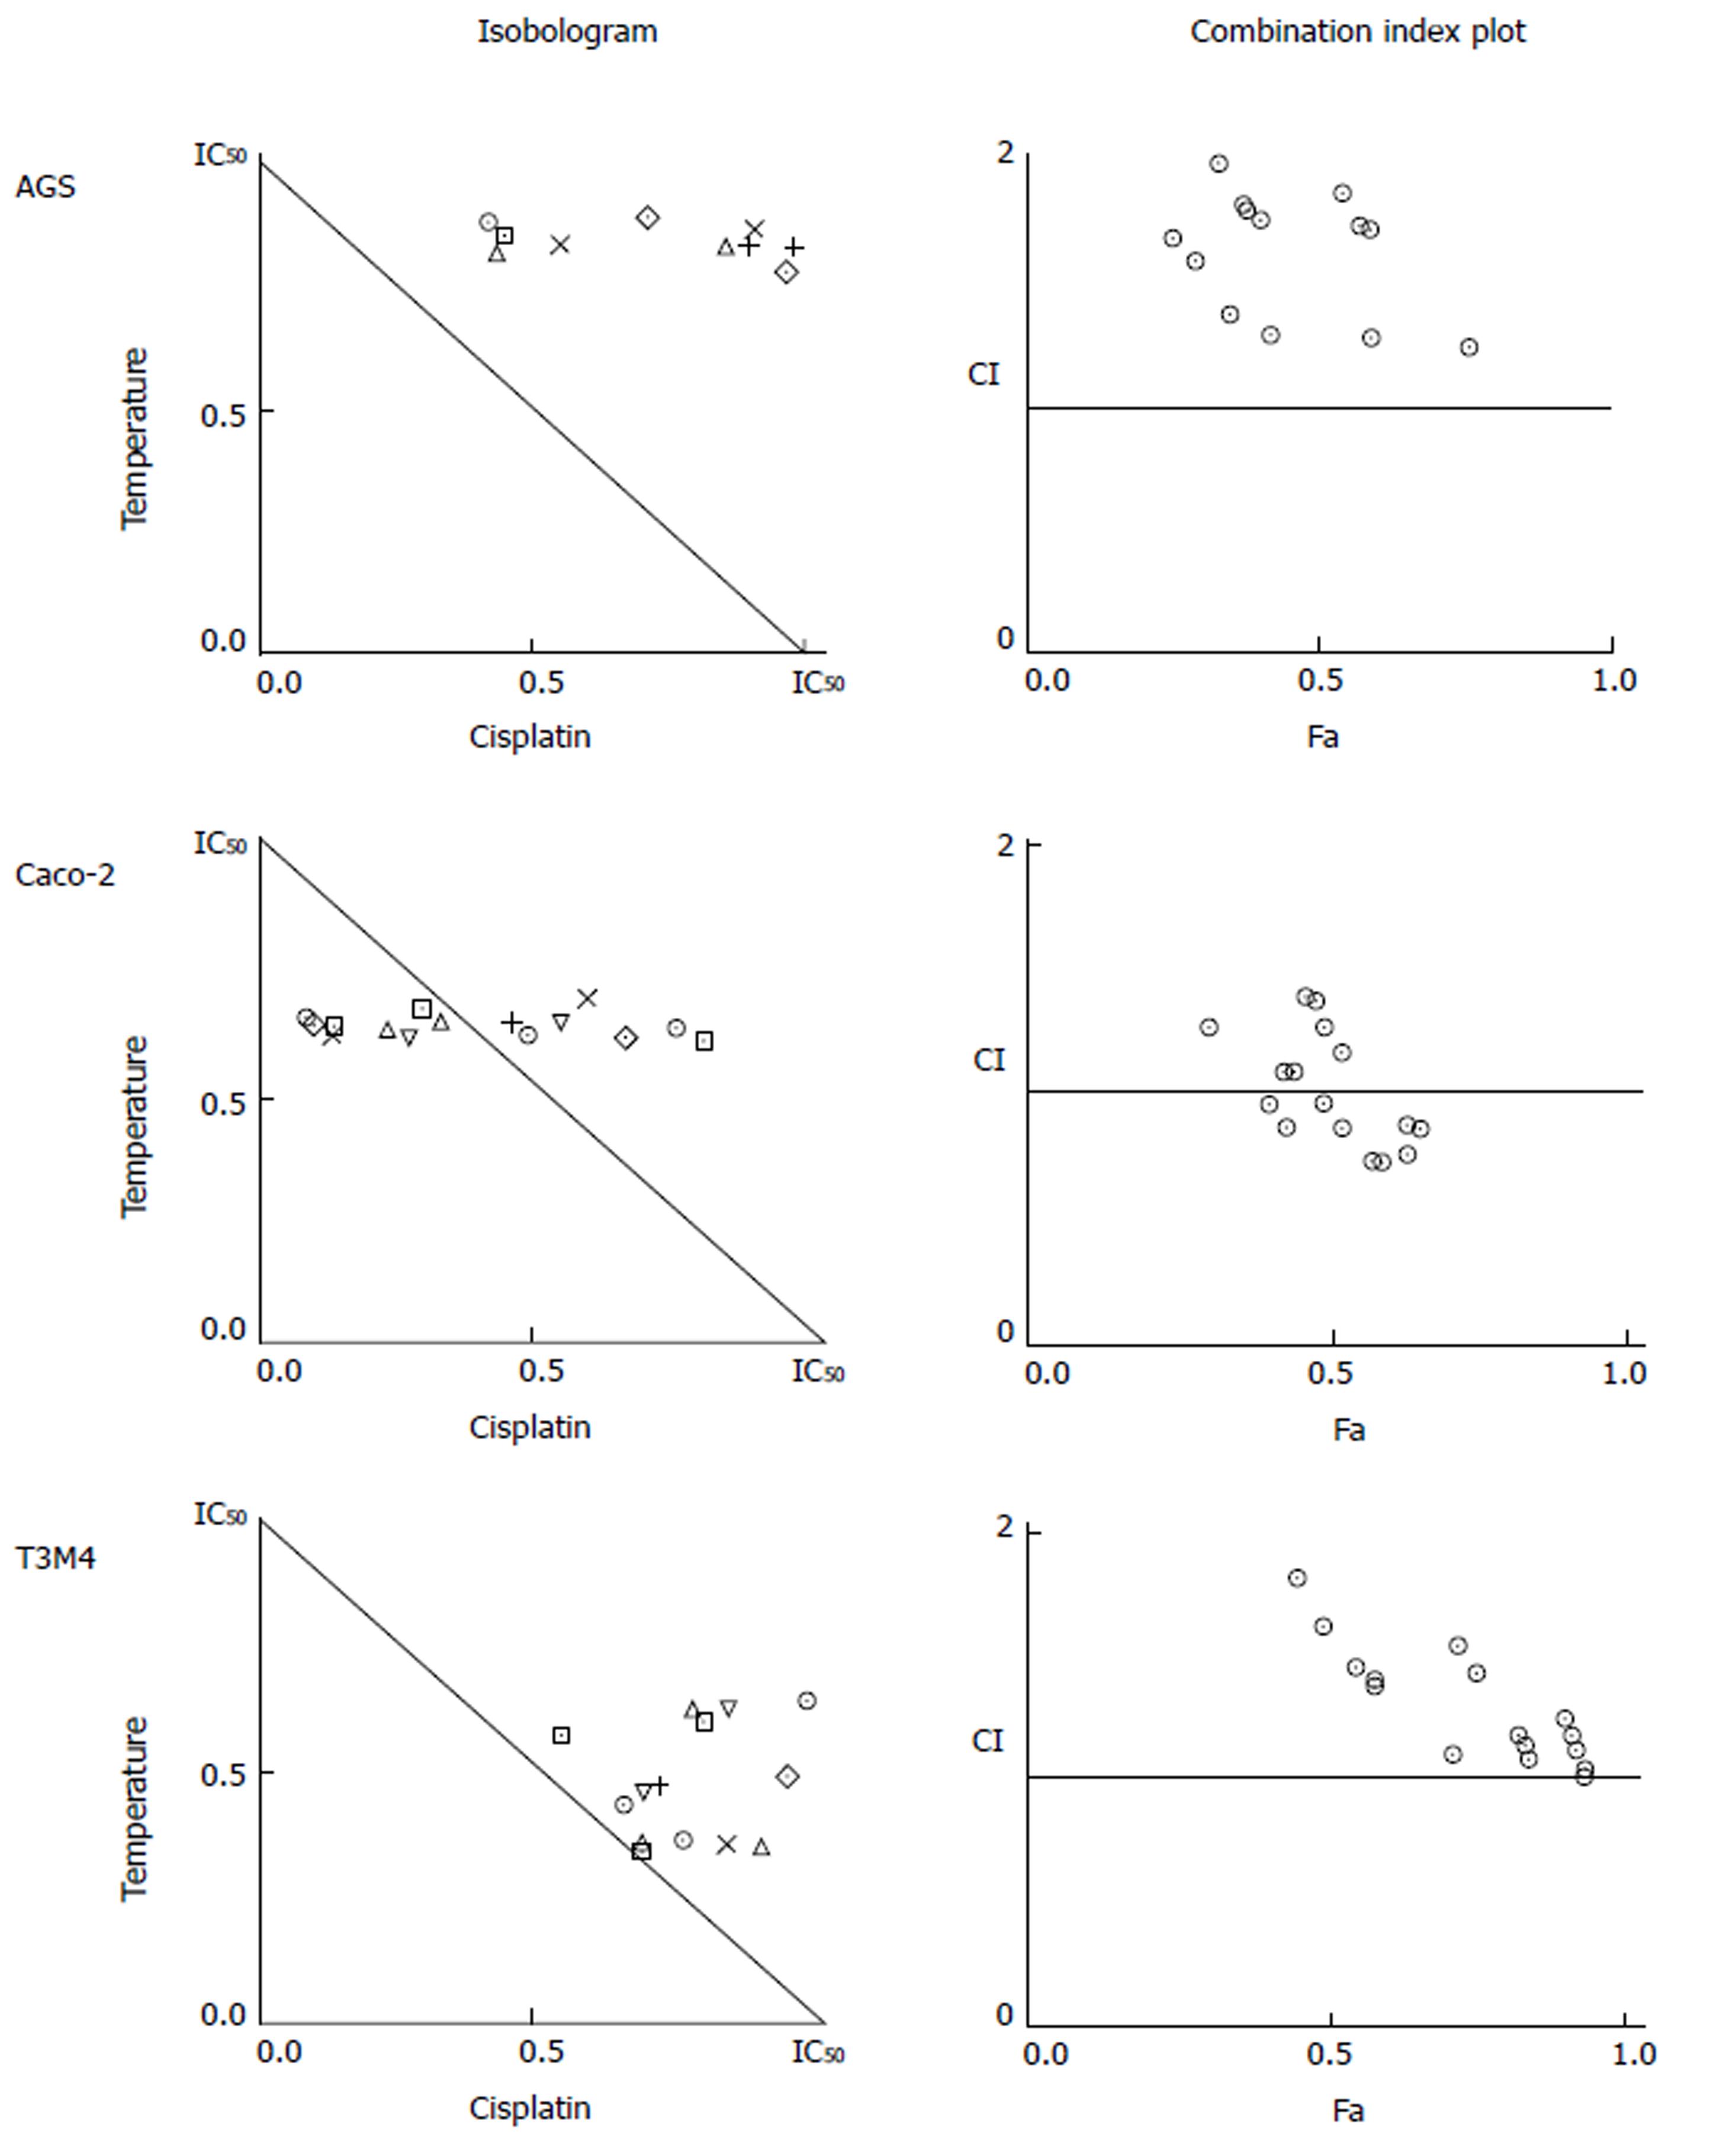
Figure 5 Interaction of temperature and cisplatin using the isobologram method for cancer cell viability.
Mathematically revealed combined effects of hyperthermia and cisplatin differ in AGS, Caco-2, and T3M4 cell lines. The isobologram represents the interaction between cisplatin and temperature resulting in inhibition of cancer cell growth. The solid line in the diagram (Combination Index = 1) indicates the alignment of theoretical values of an additive interaction between two effectors and represents calculated conditions required to inhibit cell growth by 50%. Mathematically calculated IC50 for AGS cells: temperature 51 °C, cisplatin 159 μmol/L; Caco-2 cells: temperature 66 °C, cisplatin 328 μmol/L; T3M4 cells: temperature 61 °C, cisplatin 0 μmol/L. Treatment combination points falling above the line indicate mathematical antagonism (below synergism, on the line additivity). Combination points that are distant from the line are not shown. Tables on the right represent the CI of selected combinations.
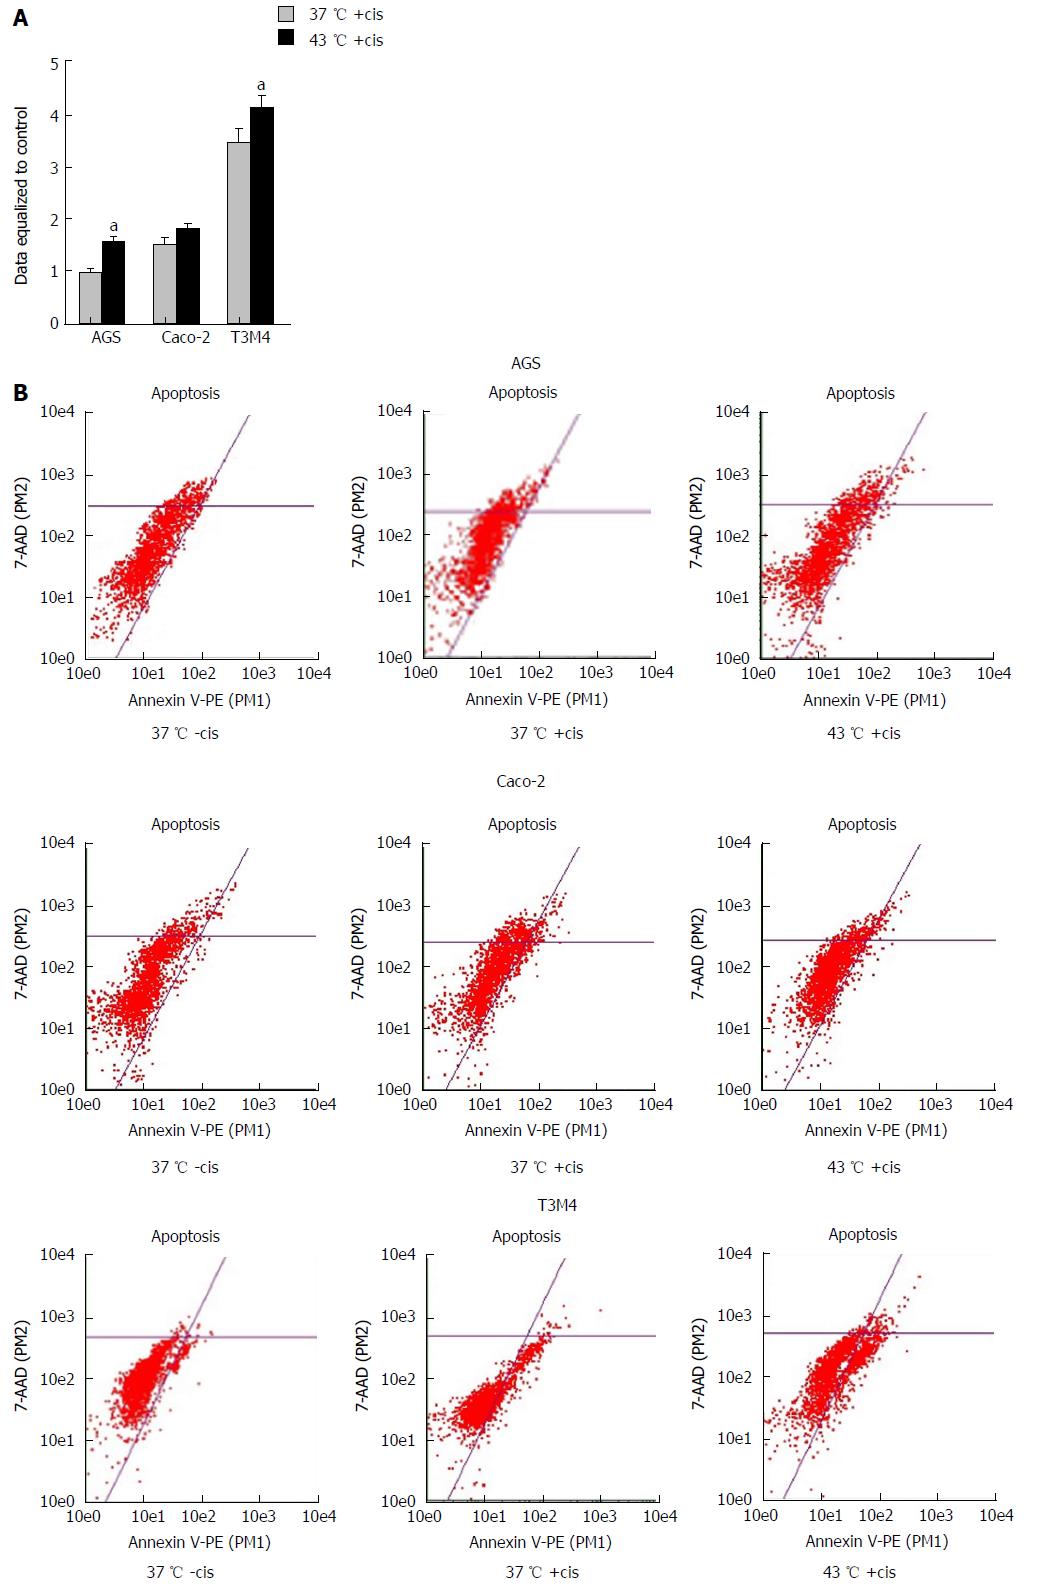
Figure 6 Apoptotic effect of temperature and cisplatin in cancer cells.
A: Early apoptosis was significantly induced by hyperthermia in cisplatin-treated cells, with the exception of Caco-2 cells, where temperature had no significant role. The dashed line represents control rates of apoptosis in untreated cells. Statistical analysis was performed using the Mann-Whitney U test. aP < 0.05. B: Dot plots presenting change of apoptosis in cisplatin untreated/treated cells and cultivated in hyperthermia. “-cis”: Cisplatin untreated cells; “+cis”: Cisplatin treated cells.
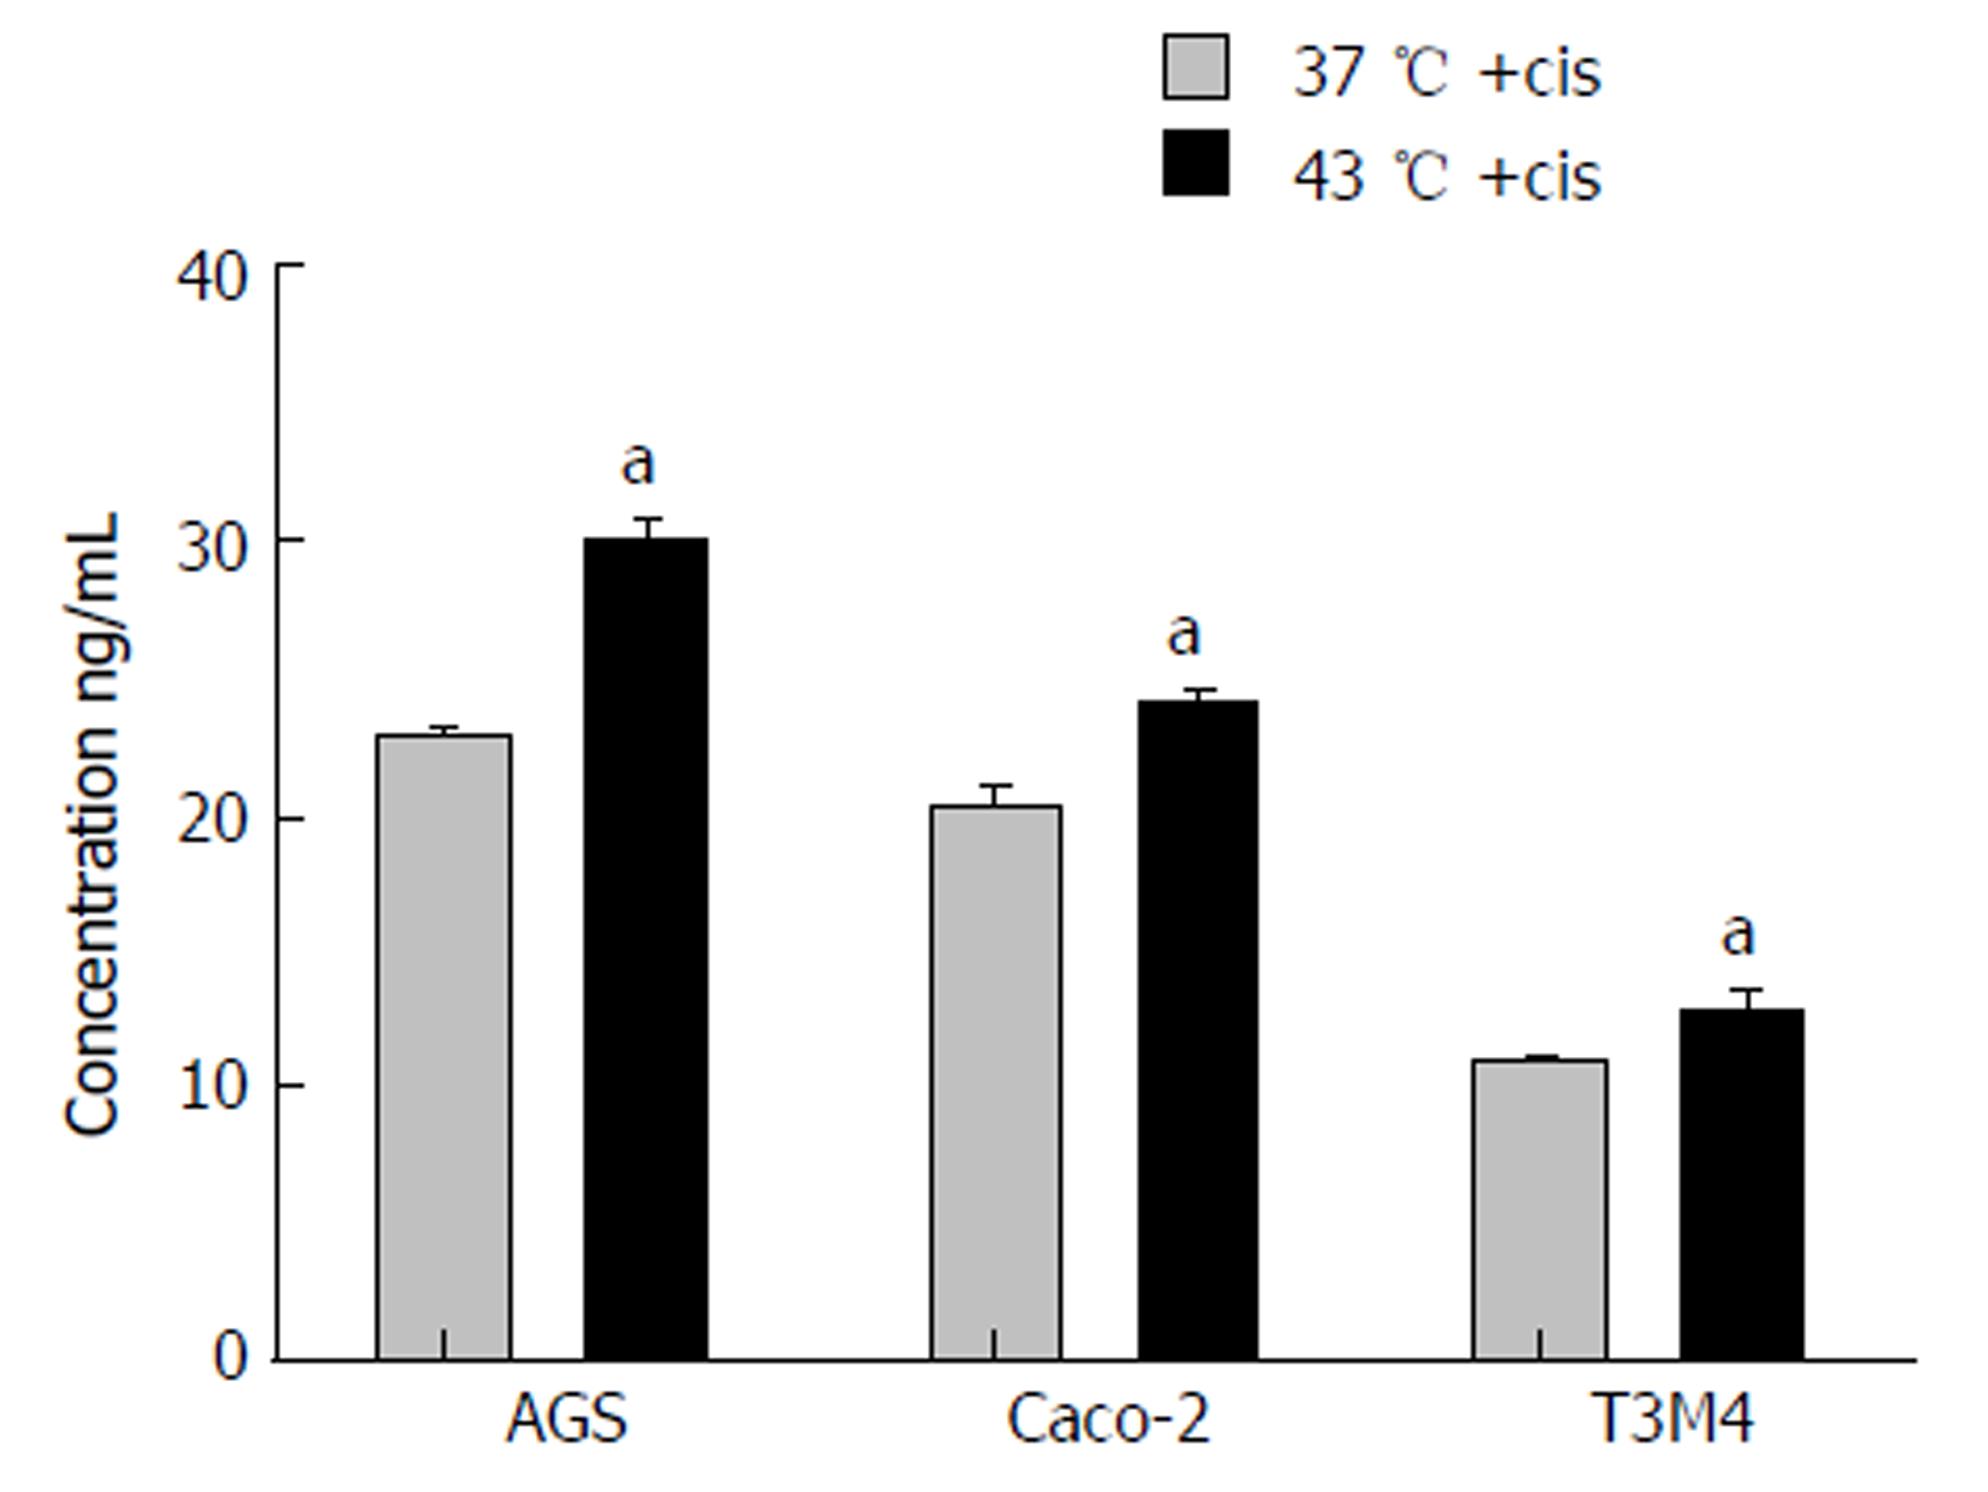
Figure 7 The change of the intracellular cisplatin concentration.
Temperature of 43 °C significantly increased the intracellular concentration of cisplatin in all analyzed cell lines. Data are shown as concentrations of ng/mL. Statistical analysis was performed using the Mann-Whitney U test. aP < 0.05. “+cis”: Cisplatin treated cells.
- Citation: Cesna V, Sukovas A, Jasukaitiene A, Naginiene R, Barauskas G, Dambrauskas Z, Paskauskas S, Gulbinas A. Narrow line between benefit and harm: Additivity of hyperthermia to cisplatin cytotoxicity in different gastrointestinal cancer cells. World J Gastroenterol 2018; 24(10): 1072-1083
- URL: https://www.wjgnet.com/1007-9327/full/v24/i10/1072.htm
- DOI: https://dx.doi.org/10.3748/wjg.v24.i10.1072


