Copyright
©The Author(s) 2017.
World J Gastroenterol. Nov 28, 2017; 23(44): 7830-7839
Published online Nov 28, 2017. doi: 10.3748/wjg.v23.i44.7830
Published online Nov 28, 2017. doi: 10.3748/wjg.v23.i44.7830
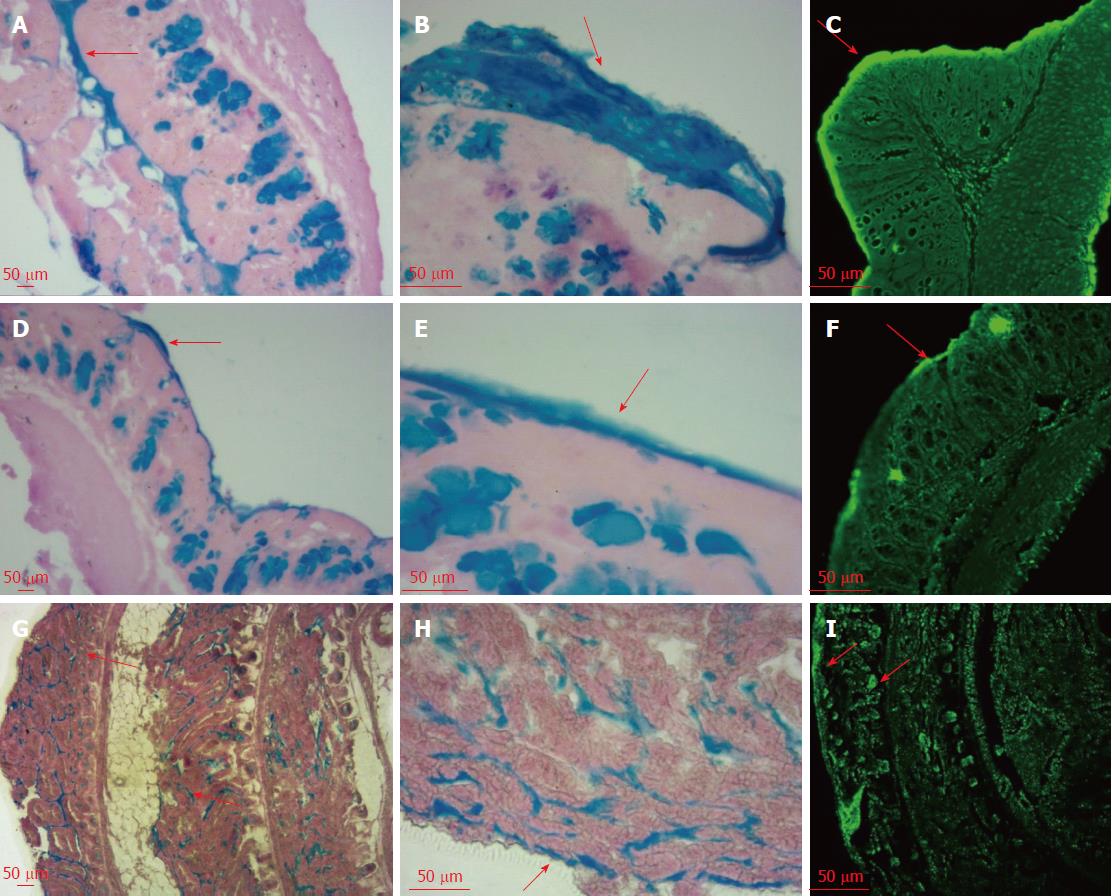
Figure 1 Mucus layer and eDNA in the mouse small intestine and colon.
The first two columns are images obtained by optical microscopy with AB-PAS staining, and the third one are images obtained by laser scanning confocal microscopy with TOTO-1 staining. Pictures from the first two rows are the colon mucus layer, while those of the third row are the small intestinal mucus layer. A-F: Colon; G-I: Small intestine; A, D, G: AB-PAS 10×; B, E, H: AB-PAS 40×; C, F, I: TOTO-1 10 ×.
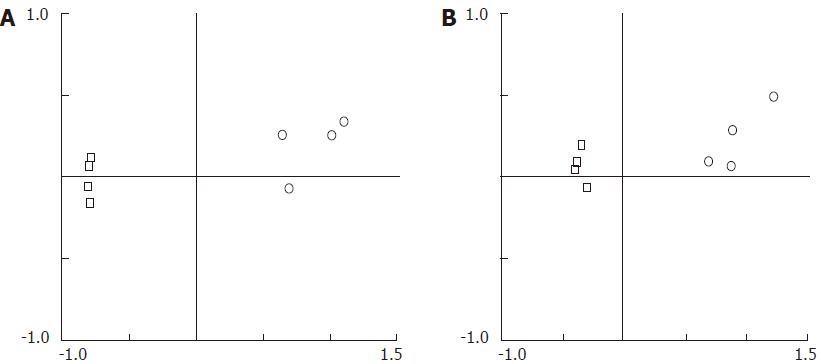
Figure 2 Principal component analysis plots for terminal restriction fragment length polymorphism profiles (including TRF size and relative abundance data).
A: with AluI. B: with DdeI; Empty circle, eDNA; Empty square, iDNA.
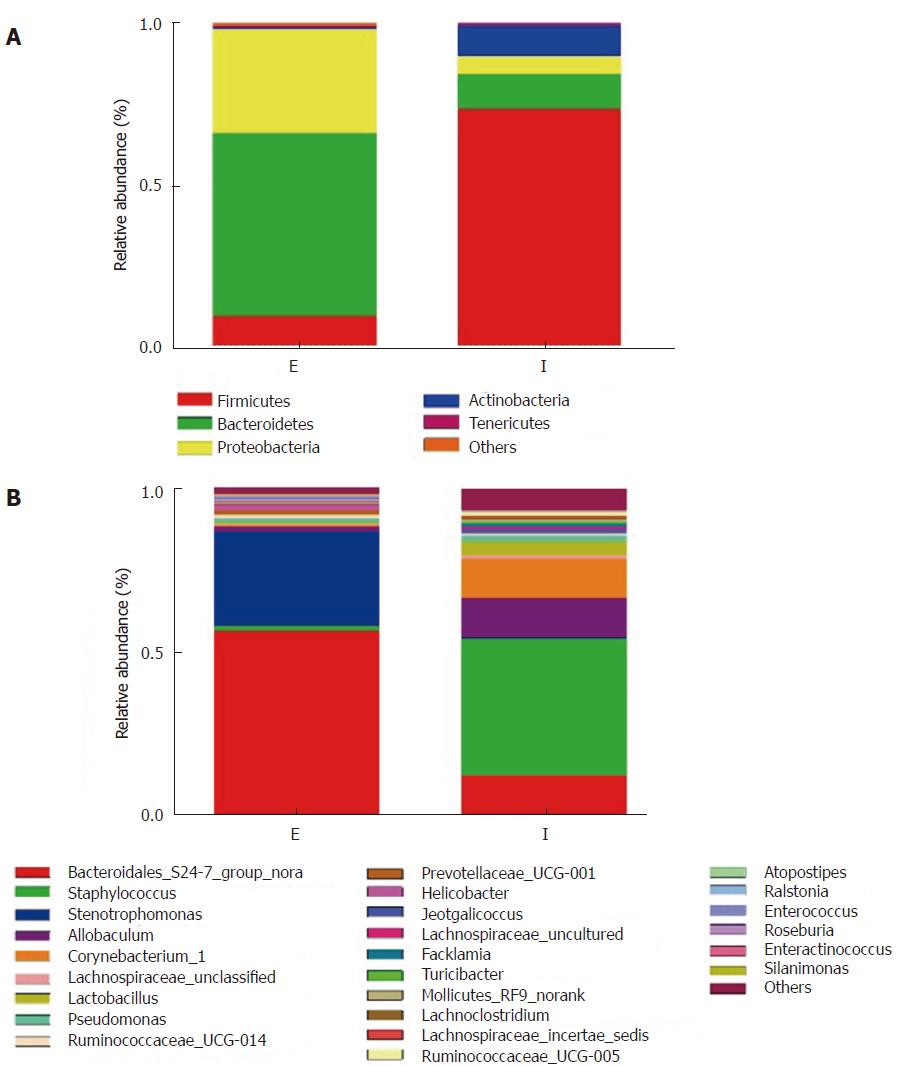
Figure 3 Community structure component diagram at the phylum (A) and genus (B) levels.
Samples were from eDNA (E) and iDNA (I) in triplicate, respectively. eDNA: Extracellular bacterial DNA; iDNA: Intracellular bacterial DNA.
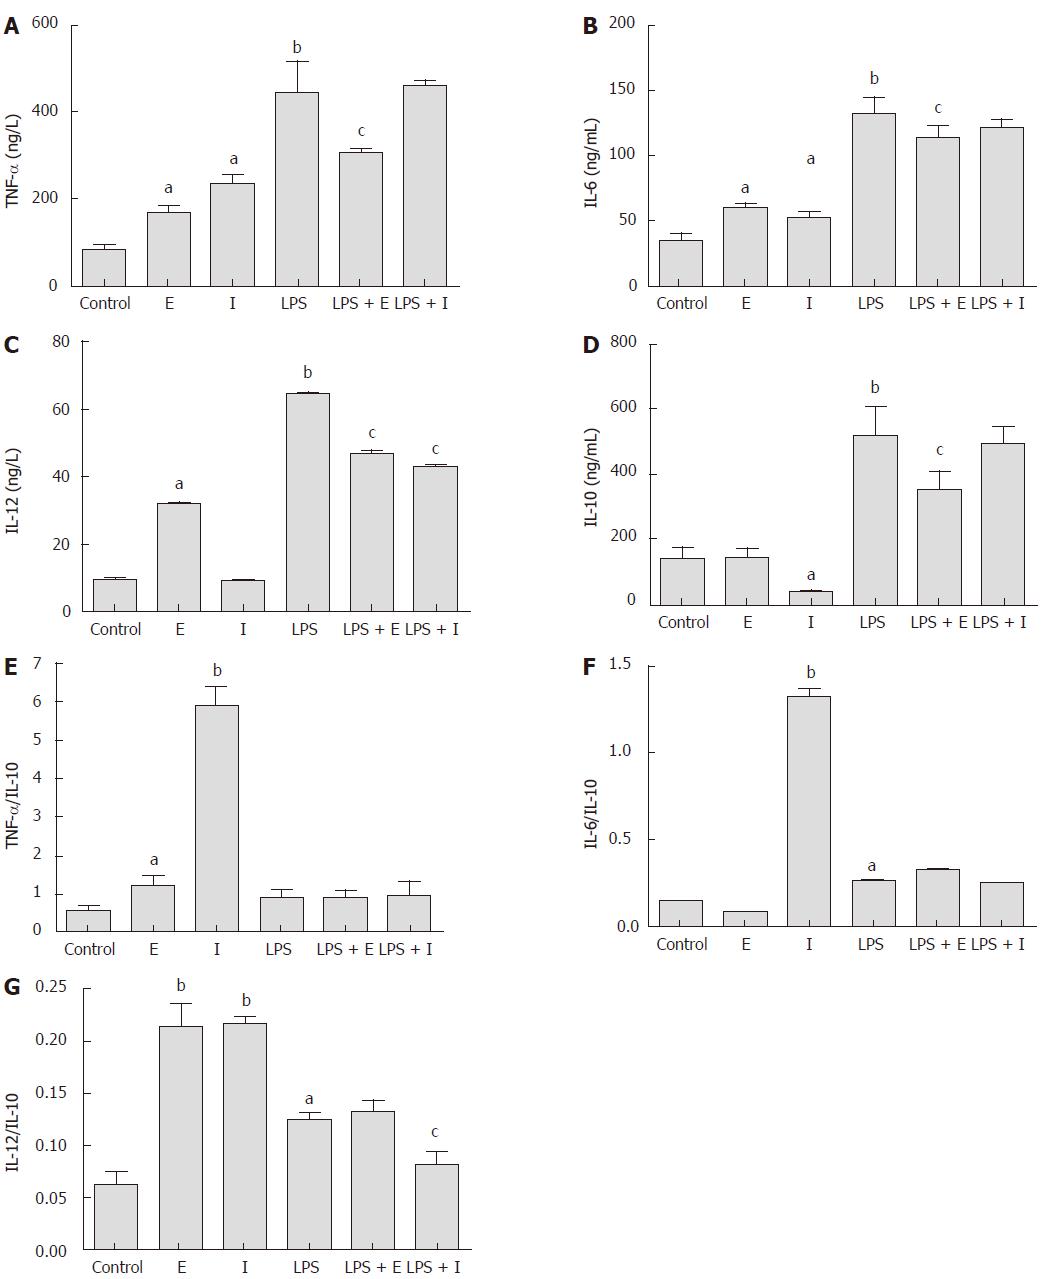
Figure 4 Effect of iDNA and eDNA on cytokine production by Raw267.
4 cells, including TNF-α (A), IL6 (B), IL-12 (C), IL-10 (D), and ratio of TNF-α (E), IL6 (F) and IL-12 (G) to IL-10. Cells were treated for 12 h with medium, lipopolysaccharide (LPS) (1 μg/mL), eDNA (1 ng/mL), iDNA (1 ng/mL), eDNA(1 ng/mL) + LPS (1 μg/mL), or iDNA (1 ng/mL) + LPS (1 μg/mL) for 12 h. Values are expressed as mean ± SEM (n = 6). aP < 0.05, Significant differences between control and treatment; bP < 0.01, significant differences between control and treatment; cP < 0.05, significant differences between LPS treatment and treatment. E: Extracellular bacterial DNA; I: Intracellular bacterial DNA; LPS: Lipopolysaccharide.
- Citation: Qi C, Li Y, Yu RQ, Zhou SL, Wang XG, Le GW, Jin QZ, Xiao H, Sun J. Composition and immuno-stimulatory properties of extracellular DNA from mouse gut flora. World J Gastroenterol 2017; 23(44): 7830-7839
- URL: https://www.wjgnet.com/1007-9327/full/v23/i44/7830.htm
- DOI: https://dx.doi.org/10.3748/wjg.v23.i44.7830


