Copyright
©The Author(s) 2017.
World J Gastroenterol. Nov 28, 2017; 23(44): 7830-7839
Published online Nov 28, 2017. doi: 10.3748/wjg.v23.i44.7830
Published online Nov 28, 2017. doi: 10.3748/wjg.v23.i44.7830
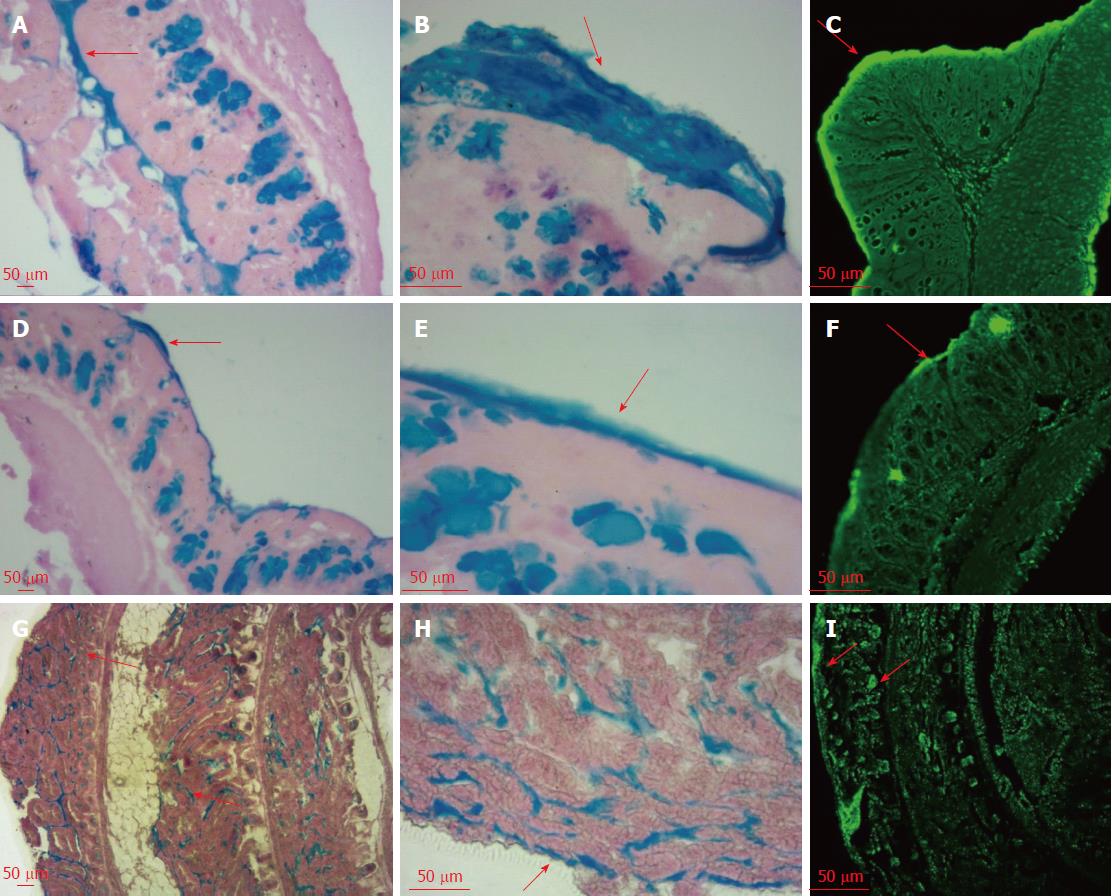
Figure 1 Mucus layer and eDNA in the mouse small intestine and colon.
The first two columns are images obtained by optical microscopy with AB-PAS staining, and the third one are images obtained by laser scanning confocal microscopy with TOTO-1 staining. Pictures from the first two rows are the colon mucus layer, while those of the third row are the small intestinal mucus layer. A-F: Colon; G-I: Small intestine; A, D, G: AB-PAS 10×; B, E, H: AB-PAS 40×; C, F, I: TOTO-1 10 ×.
- Citation: Qi C, Li Y, Yu RQ, Zhou SL, Wang XG, Le GW, Jin QZ, Xiao H, Sun J. Composition and immuno-stimulatory properties of extracellular DNA from mouse gut flora. World J Gastroenterol 2017; 23(44): 7830-7839
- URL: https://www.wjgnet.com/1007-9327/full/v23/i44/7830.htm
- DOI: https://dx.doi.org/10.3748/wjg.v23.i44.7830


