Copyright
©The Author(s) 2017.
World J Gastroenterol. Oct 14, 2017; 23(38): 6995-7008
Published online Oct 14, 2017. doi: 10.3748/wjg.v23.i38.6995
Published online Oct 14, 2017. doi: 10.3748/wjg.v23.i38.6995
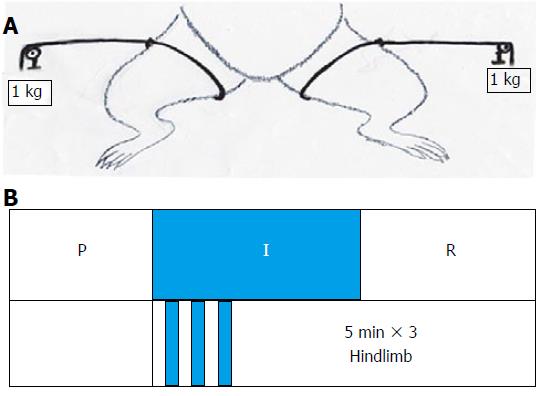
Figure 1 Remote ischemic perconditioning models.
A: Tourniquet was used for ligature of each hindlimb with 1 kg additional weight; B: P - Perfusion phase, I - Ischemic phase, R - Reperfusion phase. The remote ischemic perconditioning group underwent orthotopic liver transplantation with hindlimb ischemia and reperfusion for three 5-min cycles starting at the beginning of the anhepatic phase.
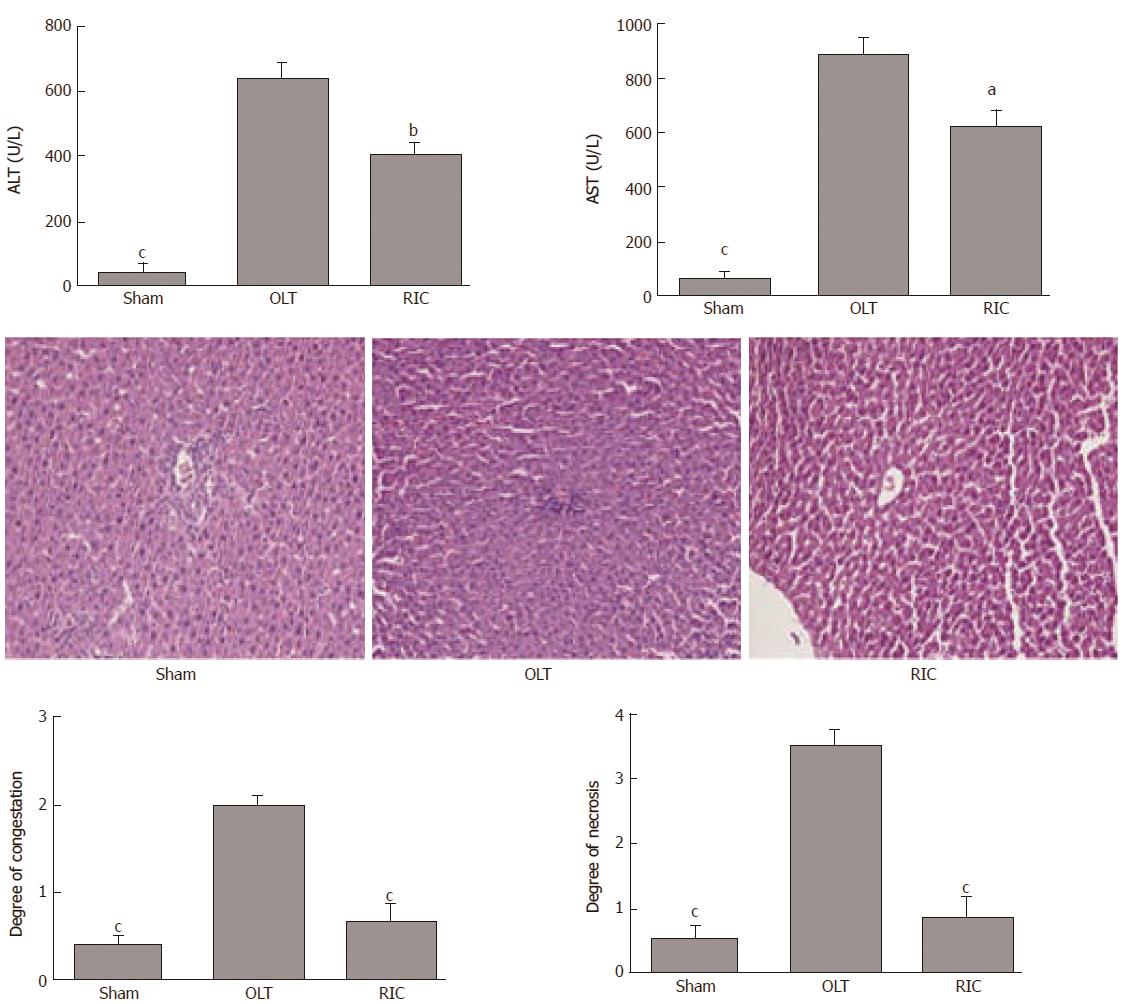
Figure 2 Remote ischemic perconditioning models model improves the liver graft function.
A: Results of ALT and AST in the three model groups; B: Liver histopathological presentations (hematoxylin and eosin stain, original magnification × 200); C: Results of hepatocyte necrosis and congestion of the sinusoids and central vein in histopathologic examination. Data represent mean ± SEM for 6 rats per group. ALT: Alanine aminotransferase; AST: aspartate aminotransferase; OLT: Orthotopic liver transplantation; RIC: Remote ischemic perconditioning. aP < 0.05; bP < 0.01; cP < 0.001.
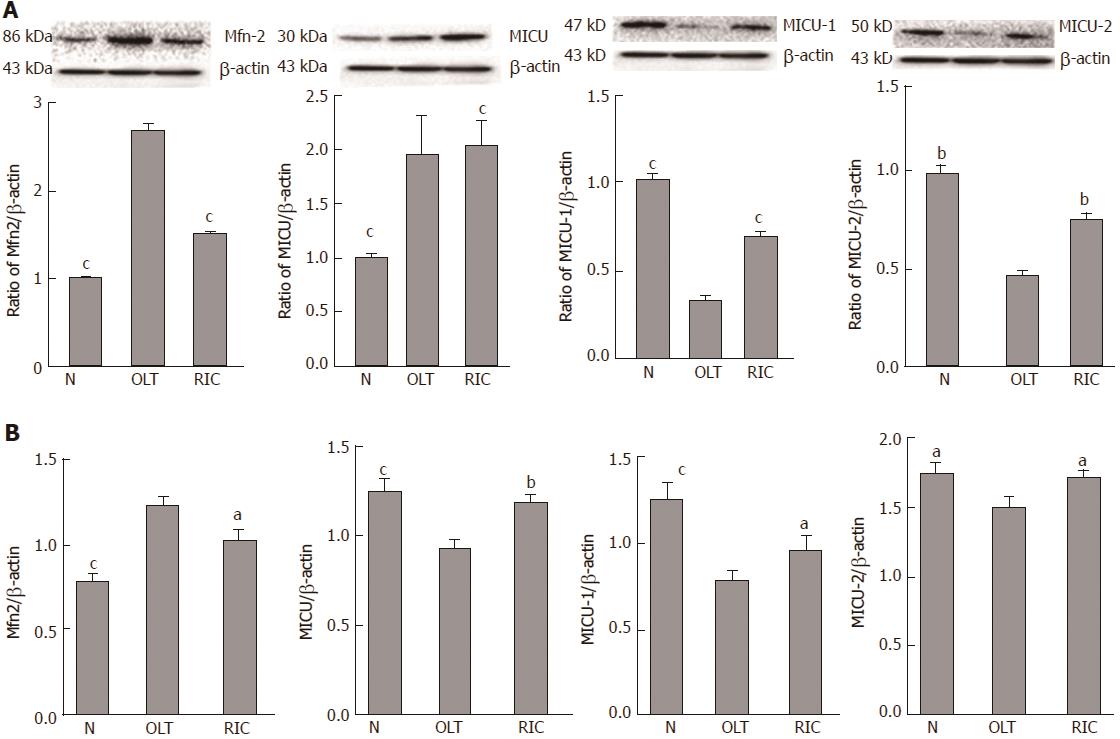
Figure 3 Remote ischemic perconditioning models model causes low expression of Mfn2 and alters MICUs expression.
Expression of Mfn2 and MICUs was measured by WB (A) and qRT-PCR (B). Both sham and RIC groups showed lower expression of Mfn2 and altered MICUs expression, but no significant change was observed in expression of mitochondrial Ca2+ uniporter. Mfn2: Mitofusin-2; MICUs: Mitochondrial Ca2+ uptake 1/2; OLT: Orthotopic liver transplantation; qRT-PCR: Quantitative real-time-PCR; RIC: Remote ischemic perconditioning; WB: Western blotting. aP < 0.05; bP < 0.01; cP < 0.001.
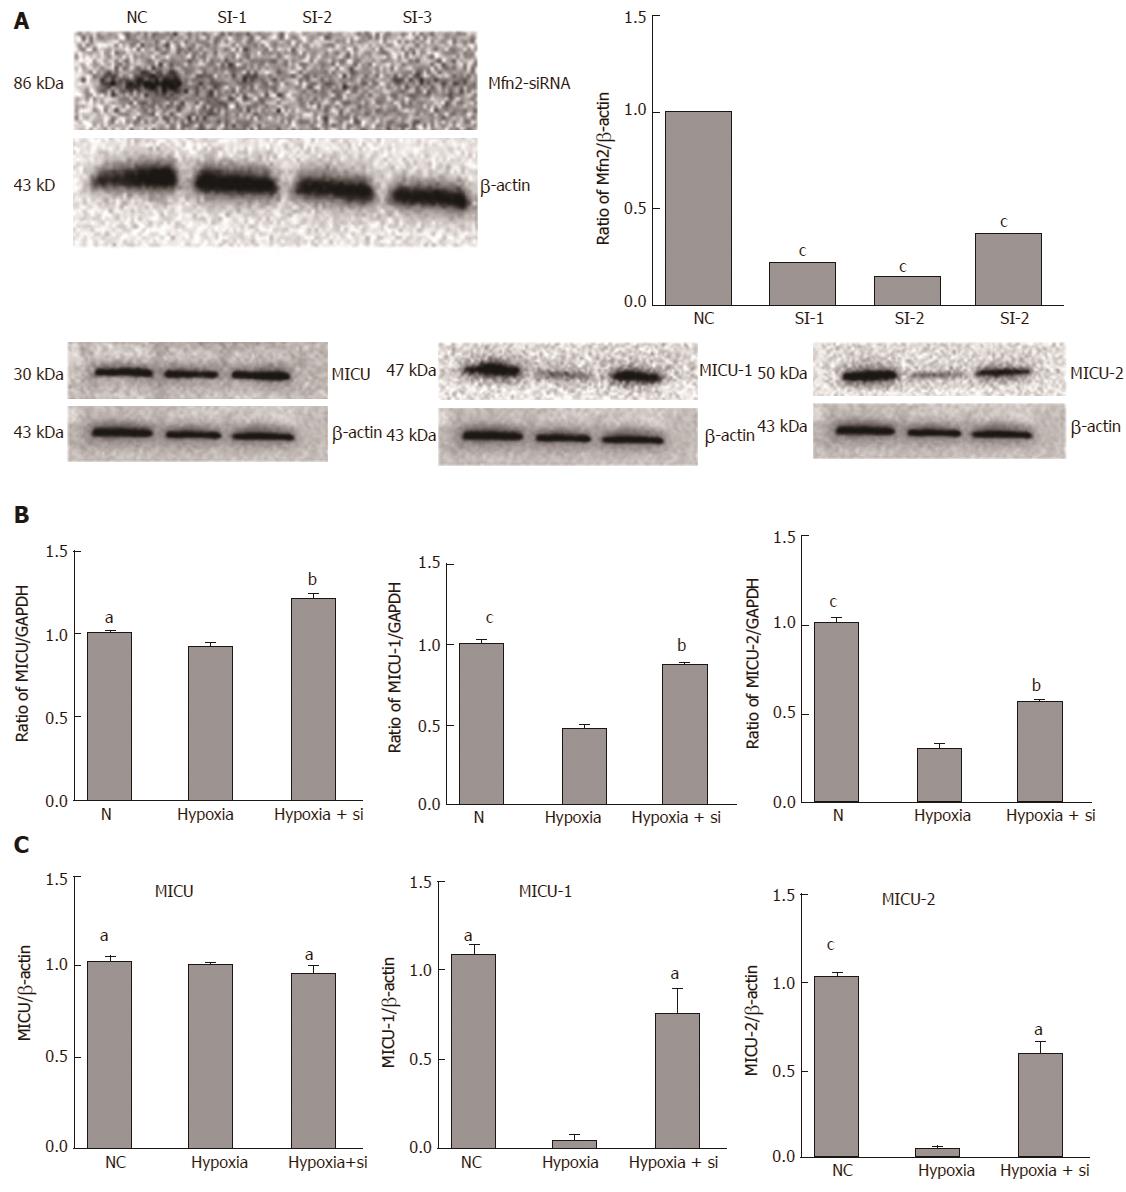
Figure 4 Mfn2 knockdown alters MICUs expression in AML-12 hypoxia cell lines.
A: Mfn2 knockdown was tested by WB and qRT-PCR. Expression of MICUs in AML-12 hypoxia cell lines was measured by WB (B) and qRT-PCR (C). Taking the hypoxia group as the reference, both the NC and hypoxia + Si groups showed higher expression of MICU-1 and similar expression of MICU-2; MCU altered expression in WB, but no significant change in qRT-PCR. AML: Alpha mouse liver; MCU: Mitochondrial Ca2+ uniporter; Mfn2: Mitofusin-2; MICU: Mitochondrial Ca2+ uptake; NC: Normal culture; qRT-PCR: Quantitative real-time-PCR; WB: Western blotting. aP < 0.05; bP < 0.01.S cP < 0.001.
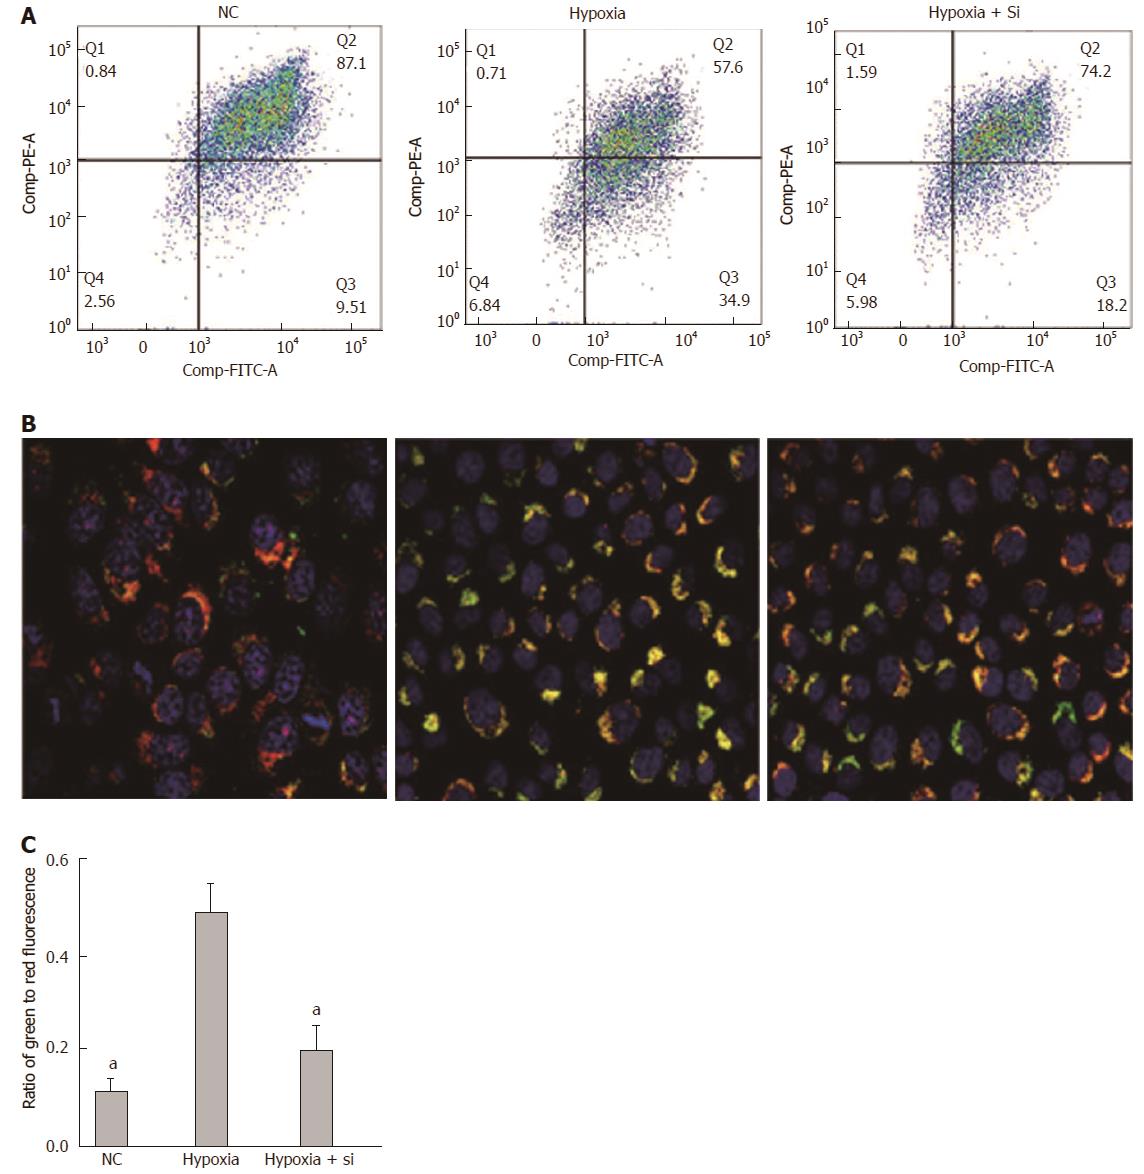
Figure 5 Mfn2 knockdown attenuates the collapse of ΔΨm in AML-12 hypoxia cell lines.
JC-1 kit and Hoechst-33342 were used to measure the ΔΨm by flow cytometry (A and C) and confocal microscopy (B). Collapse of ΔΨm in the hypoxia group was attenuated both in the NC and hypoxia + Si groups. Mfn2: Mitofusin-2; NC: Normal culture; ΔΨm: Mitochondrial membrane potential. aP < 0.05.
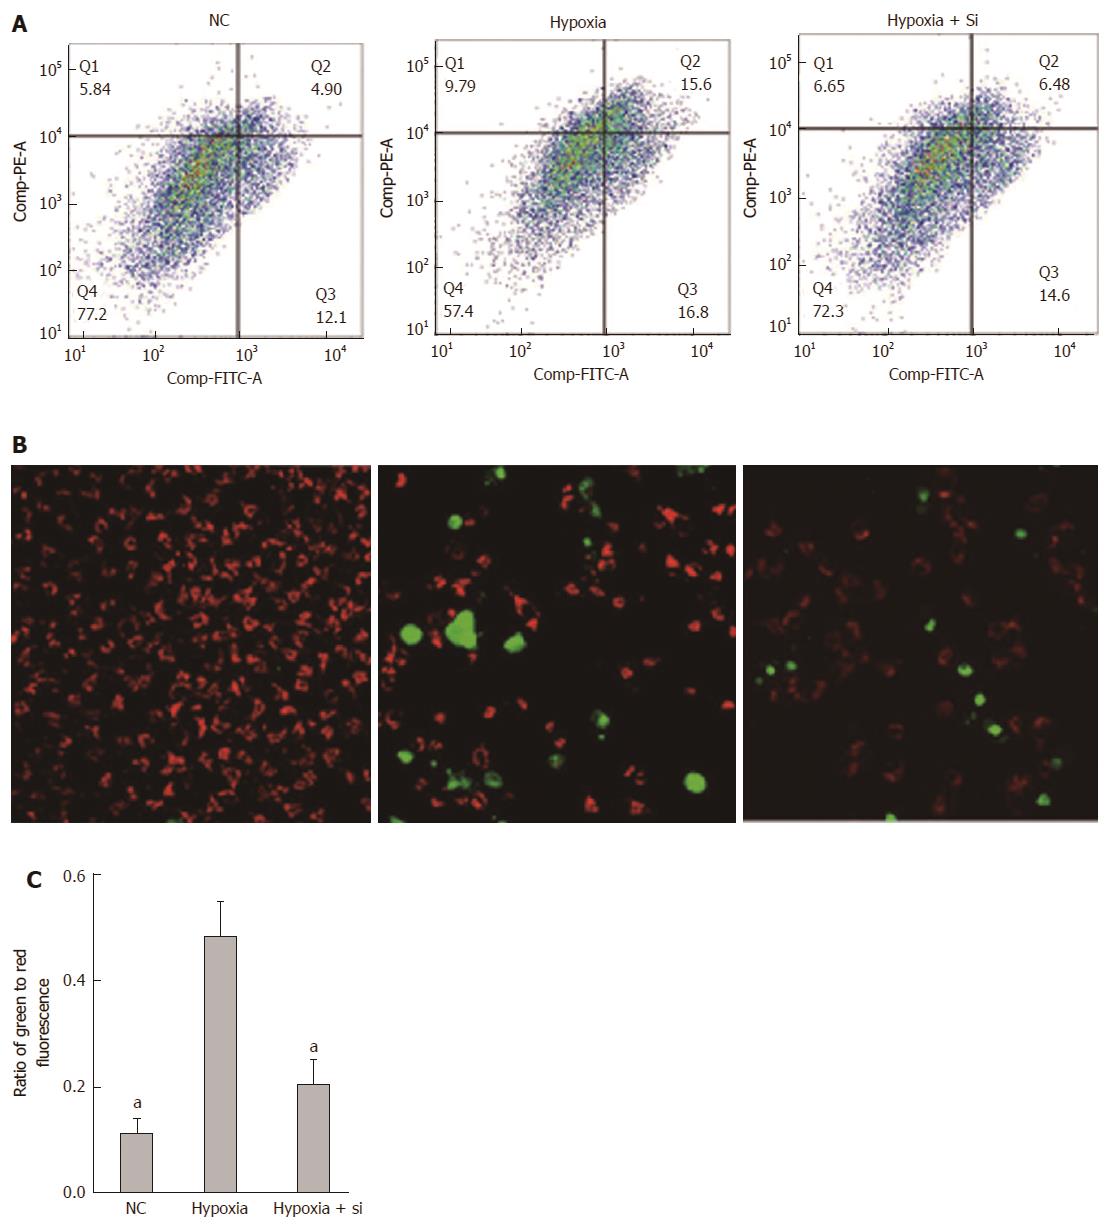
Figure 6 Mnf2 knockdown attenuates apoptosis in AML-12 hypoxia cell lines.
The Annexin V/PI Apoptosis Detection Kit by flow cytometry (A and C); Caspase 3/7 detection kit and tetramethylrhodamine methyl ester perchlorate by confocal microscopy (B) used to detect apoptosis. The ratio of apoptosis cells was lower in both the NC and hypoxia + Si groups. AML: Alpha mouse liver; Mfn2: Mitofusin-2; NC: Normal culture. aP < 0.05.
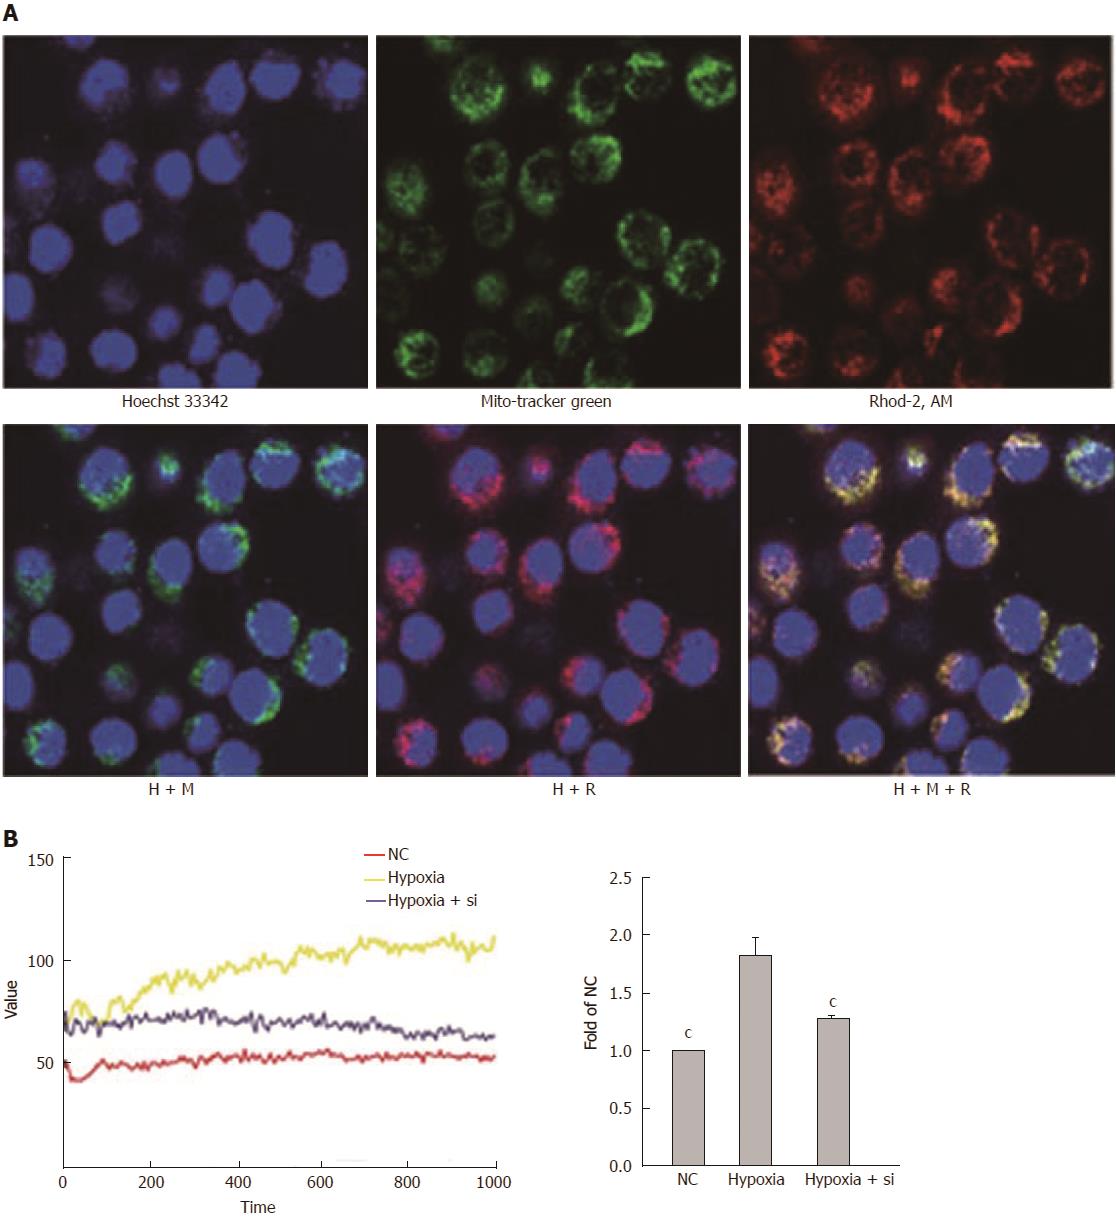
Figure 7 Mfn2 knockdown relieves mitochondrial Ca2+ overloading.
Rhod-2 AM was used to detect mitochondrial Ca2+ concentrations by confocal microscopy and VarioskanFlash. A: Confocal microscopy confirmed that the vast majority of Rhod-2 AM fluorescence was associated with the mitochondria; B: VarioskanFlash was used to detect Rhod-2 AM to determine the fluorescence of mitochondrial Ca2+ concentrations. Taking the hypoxia group as the reference, both the NC and hypoxia + Si groups relieved mitochondrial Ca2+ overloading. Mfn2: Mitofusin-2; NC: Normal culture; Rhod-2 AM: Rhod-2 acetoxymethyl ester. cP < 0.001.
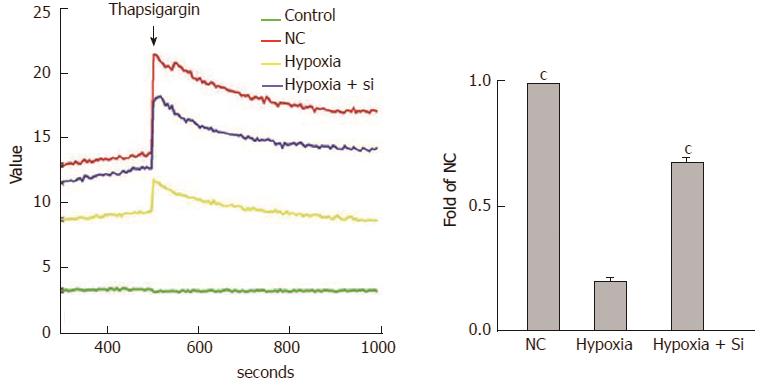
Figure 8 Mfn2 knockdown relieves endoplasmic reticulum Ca2+ decrease.
FLUOFORTE® Calcium Assay and thapsigargin were used to detect ER Ca2+ concentrations by VarioskanFlash. Taking the hypoxia group as the reference, both the NC and hypoxia + Si groups showed higher ER Ca2+ concentrations. ER: Endoplasmic reticulum; Mfn2: Mitofusin-2; NC: Normal culture. cP < 0.001.
- Citation: Liang RP, Jia JJ, Li JH, He N, Zhou YF, Jiang L, Bai T, Xie HY, Zhou L, Sun YL. Mitofusin-2 mediated mitochondrial Ca2+ uptake 1/2 induced liver injury in rat remote ischemic perconditioning liver transplantation and alpha mouse liver-12 hypoxia cell line models. World J Gastroenterol 2017; 23(38): 6995-7008
- URL: https://www.wjgnet.com/1007-9327/full/v23/i38/6995.htm
- DOI: https://dx.doi.org/10.3748/wjg.v23.i38.6995


