Copyright
©The Author(s) 2017.
World J Gastroenterol. Sep 14, 2017; 23(34): 6339-6349
Published online Sep 14, 2017. doi: 10.3748/wjg.v23.i34.6339
Published online Sep 14, 2017. doi: 10.3748/wjg.v23.i34.6339
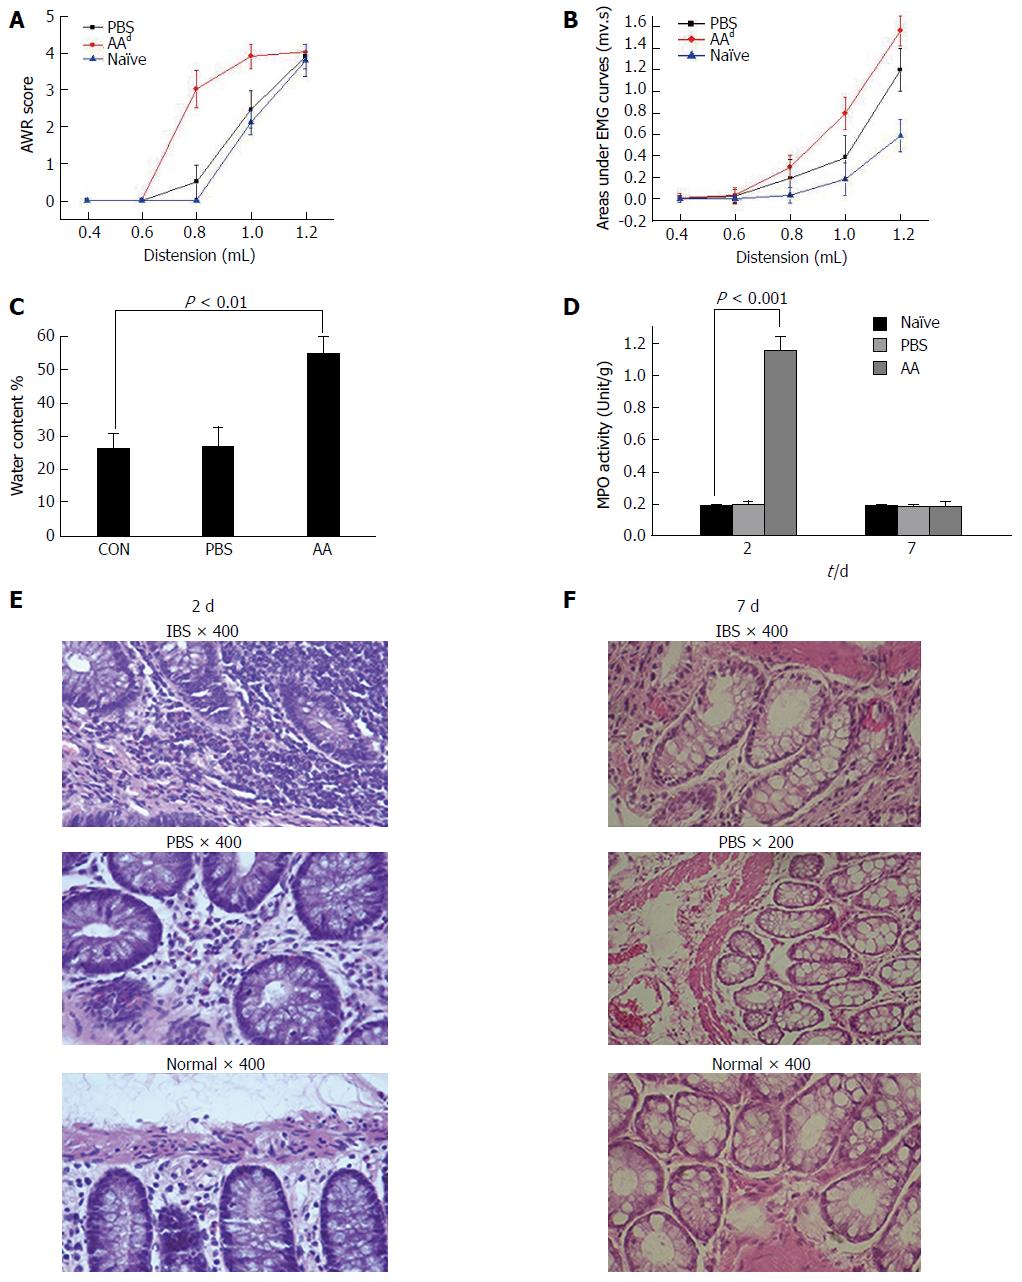
Figure 1 Model assessment using histological sections, myeloperoxidase activity, stool water content and visceral hypersensitivity in the acetic acid rats.
A and B: The AWR score was significantly increased at distension volumes of 0.8 and 1.0 mL in the AA model compared with the two control groups and overlapped at 1.2 mL on a highest score of 4. The AUC significantly increased at volumes of 0.8, 1.0 and 1.2 mL in the AA rats compared with the control groups. No significant change was found in the PBS group compared with naïve rats; C: The water contents of stools from the naïve, PBS and AA groups were compared (one-way ANOVA, P < 0.01). AA rats showed much looser stool, and the water content was much higher; D: Tissue MPO activity on the 2nd and 7th d of modeling. MPO activity of the AA group was increased on the 2nd d of modeling. No statistically significant difference was detected between the PBS and naïve groups on the 2nd and 7th d of modeling among the AA, PBS and naïve groups (one-way ANOVA, P < 0.001 vs the control groups); E and F: Histology sections of colonic tissue from AA, PBS and naïve rats on the 2nd and 7th d. On the 2nd d of modeling in the AA group, histological inflammatory features including mucosal hemorrhage, submucosal edema, and inflammatory infiltration in the lamina propria and submucosa were observed. No remarkable inflammatory features were observed in the two control groups on the 2nd d of modeling and in all the three groups (AA, PBS and naïve rats) on the 7th d of modeling. dP < 0.001 vs the control groups. AWR: Abdominal withdrawal reflex; AUC: Area under the electromyography curve; AA: acetic acid; IBS: Irritable bowel syndrome; EMG: Electromyography.
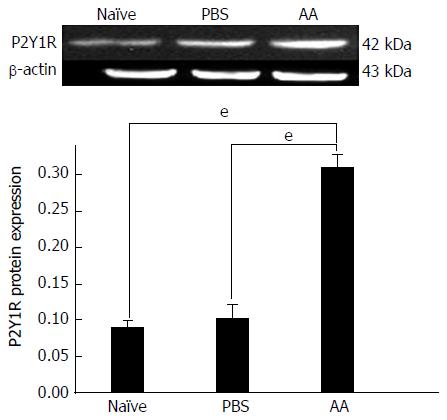
Figure 2 Western blot analysis of P2Y1R expression in the acetic acid, PBS and naïve rats.
The average expression of P2Y1R (as determined by densitometry) was significantly higher in the AA group than in the control groups. No significant changes was found between the PBS group and naïve group. β-actin served as an internal control. eP < 0.001 vs the control groups. AA: acetic acid.
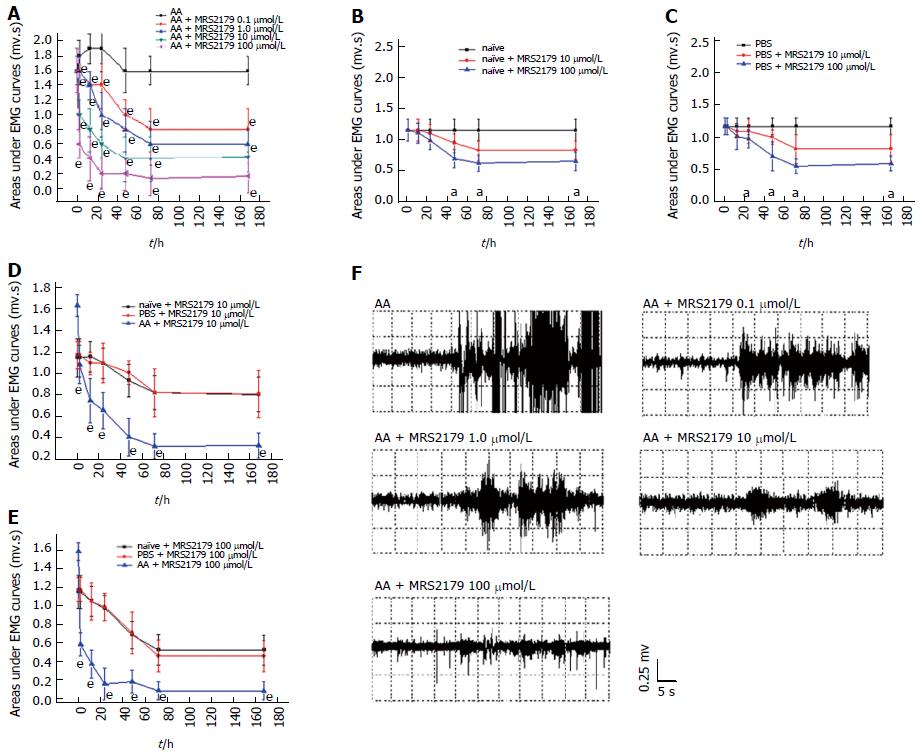
Figure 3 Concentration selection of MRS2179.
A: Treatment with the specific P2Y1R antagonist MRS2179 evoked a pain-related visceral motor response in AA rats upon colorectal distension. A significant decrease was observed at concentrations of 0.1 to 100 μmol/L at 2 to 168 h time points. MRS2179 at 100 μmol/L produced the most pronounced result. Maximal effects of MRS2179 were observed at 100 μmol/L at 72 h from a mean baseline AUC value of 1.587 ± 0.099 m.vs to 0.140 ± 0.089 m.vs; B: On naïve rats, MRS2179 at doses of 10 and 100 μmol/L was found to be effective after 48 h; C: On PBS rats, MRS2179 at doses of 10 and 100 μmol/L was found to be effective after 24 h; D and E: AUC of naïve, PBS and AA rats treated with MRS2179 at doses of 10 and 100 μmol/L. There were significant differences between AA rats and naïve/PBS rats at doses of 10 and 100 μmol/L, although differences between naïve and PBS rats were not significant for the two doses; F: AUC of AA rats treated with MRS2179 (from doses of 0.1 to 100 μmol/L) at 72 h time point. aP < 0.05, eP < 0.0001 vs the control group. AUC: Area under the electromyography curve; AA: acetic acid; EMG: Electromyography.
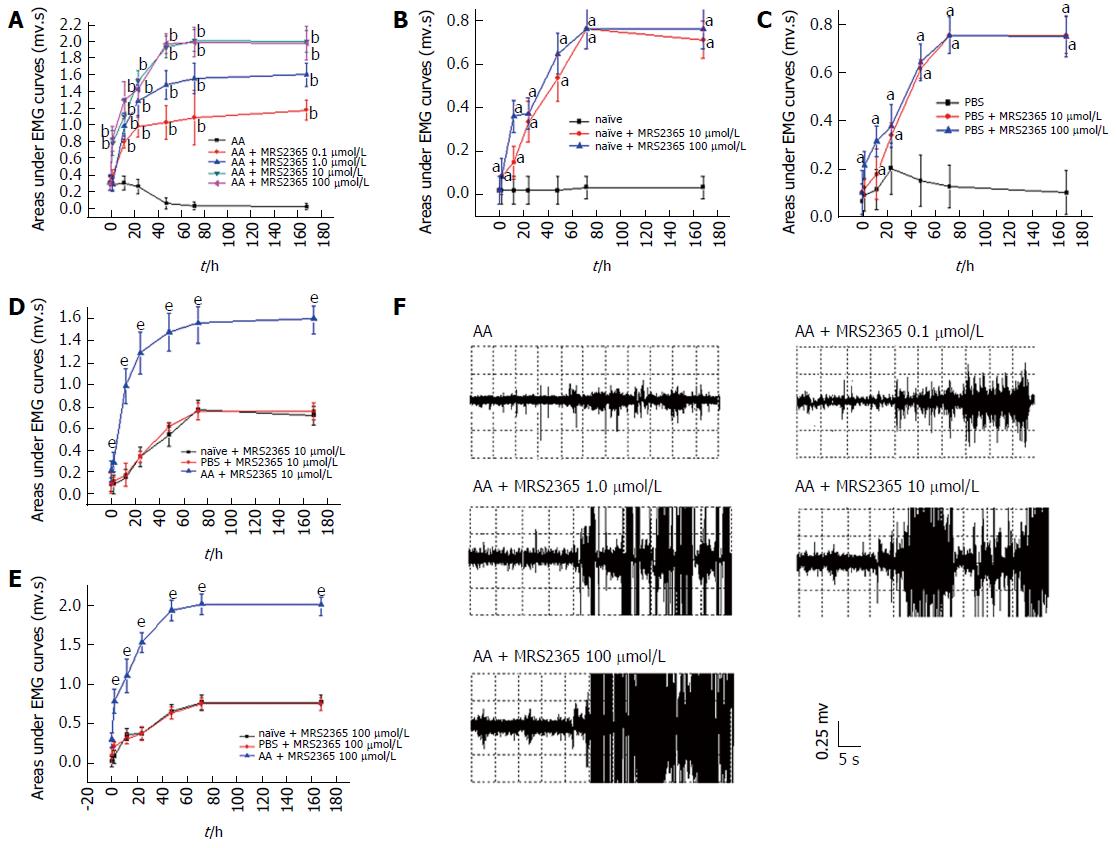
Figure 4 Concentration selection of MRS2365.
A: Treatment with the specific P2Y1R agonist MRS2365-evoked pain elicited a visceral motor response in AA rats upon colorectal distension. The AUC was significantly increased in all of the MRS2365 groups (0.1, 1.0, 10 and 100 μmol/L) compared with the AA control group. The MRS2365 doses at 10 and 100 μmol/L elicited the most effective result. There was no significant difference between the concentrations of 10 and 100 μmol/L; B and C: On naïve and PBS rats, MRS2365 at doses of 10 and 100 μmol/L was found to be effective at 2 to 168 h time points ; D and E: AUC of naïve, PBS and AA rats treated with MRS2365 at doses of 10 and 100 μmol/L. Significant differences were found between AA and naïve/PBS rats at doses of 10 and 100 μmol/L, while differences between naïve and PBS rats were not significant for the two doses; F: AUC of AA rats treated with MRS2365 (from doses of 0.1 to 100 μmol/L) at 72 h time point. aP < 0.05, bP < 0.01, eP < 0.0001 vs the control group. AUC: Area under the electromyography curve; AA: acetic acid; EMG: Electromyography.
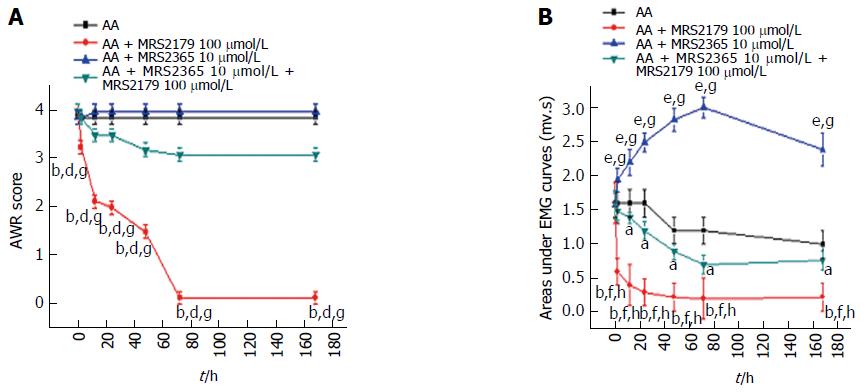
Figure 5 Drug intervention in acetic acid rats.
A: AWR scores showed that MRS2179 could significant decrease the abdominal responses. Differences between the MRS2179 group and the untreated AA rats, MRS2365 group or the combined treatment group were significant. No difference was detected between untreated AA rats and MRS2365 treated rats or rats of the combination group; B: Significant differences of EMG curves were also detected. A significant decrease was detected in the MRS2179 group, which reached a peak at 72 h and continued to persist at 168 h. A significant increase was detected in the MRS2365 group (peaked at 72 h). The difference between the MRS2179 and MRS2365 groups or rats of the combination group was significant. Compared with rats of the combination group, significant differences were detected for untreated AA rats and the MRS2365 group. aP < 0.05, bP < 0.01, eP < 0.001 vs the untreated control group; dP < 0.01, fP < 0.001 vs the MRS2365 group; gP < 0.01, hP < 0.001 vs the combination group. AWR: Abdominal withdrawal reflex; AUC: Area under the electromyography curve; AA: acetic acid; EMG: Electromyography.
- Citation: Wu J, Cheng Y, Zhang R, Liu D, Luo YM, Chen KL, Ren S, Zhang J. P2Y1R is involved in visceral hypersensitivity in rats with experimental irritable bowel syndrome. World J Gastroenterol 2017; 23(34): 6339-6349
- URL: https://www.wjgnet.com/1007-9327/full/v23/i34/6339.htm
- DOI: https://dx.doi.org/10.3748/wjg.v23.i34.6339


