Copyright
©The Author(s) 2017.
World J Gastroenterol. Sep 14, 2017; 23(34): 6212-6219
Published online Sep 14, 2017. doi: 10.3748/wjg.v23.i34.6212
Published online Sep 14, 2017. doi: 10.3748/wjg.v23.i34.6212
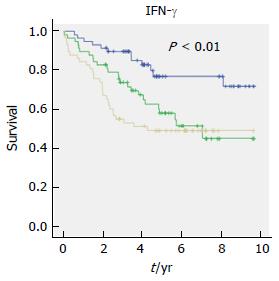
Figure 1 Kaplan-Meier curve of IFN-γ as an example of an inflammatory factor significant for total mortality.
Upper blue line: lowest tertile levels in pg/mL; middle green line: middle tertile levels in pg/mL; lower yellow line: highest tertile levels in pg/mL.
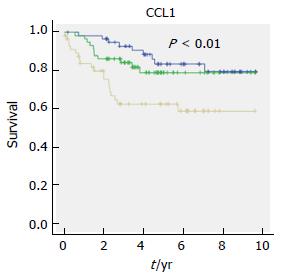
Figure 2 Kaplan-Meier curve of CCL1 as an example of an inflammatory factor significant for colorectal cancer-specific mortality in a multivariate analysis.
Upper blue line: lowest tertile levels in pg/mL; middle green line: middle tertile levels in pg/mL; lower yellow line: highest tertile levels in pg/mL.
- Citation: Olsen RS, Nijm J, Andersson RE, Dimberg J, Wågsäter D. Circulating inflammatory factors associated with worse long-term prognosis in colorectal cancer. World J Gastroenterol 2017; 23(34): 6212-6219
- URL: https://www.wjgnet.com/1007-9327/full/v23/i34/6212.htm
- DOI: https://dx.doi.org/10.3748/wjg.v23.i34.6212


