Copyright
©The Author(s) 2017.
World J Gastroenterol. Aug 21, 2017; 23(31): 5713-5721
Published online Aug 21, 2017. doi: 10.3748/wjg.v23.i31.5713
Published online Aug 21, 2017. doi: 10.3748/wjg.v23.i31.5713
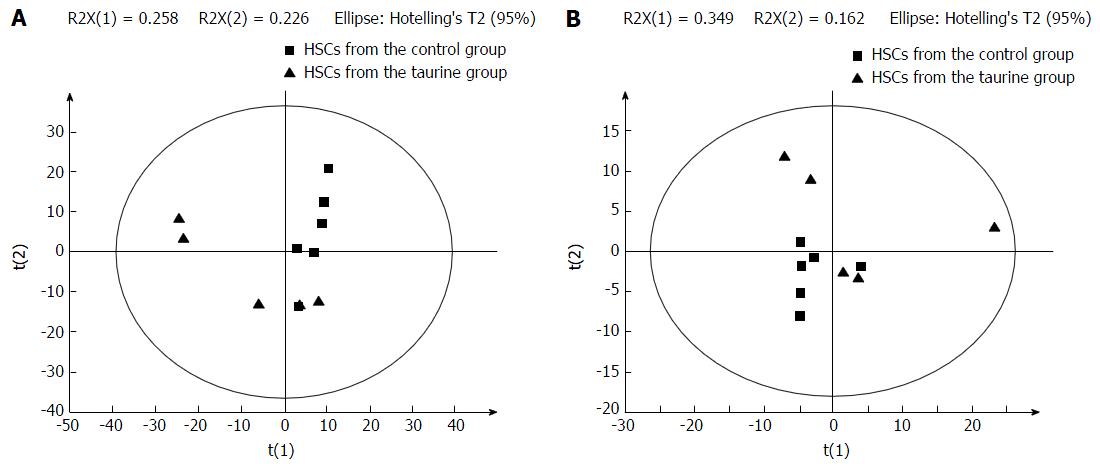
Figure 1 Principal component analysis plots of biological metabolites for taurine in hepatic stellate cells in electrosprayionization+ mode (A) and in electrosprayionization- mode (B).
HSCs: Hepatic stellate cells; ESI: Electrosprayionization.
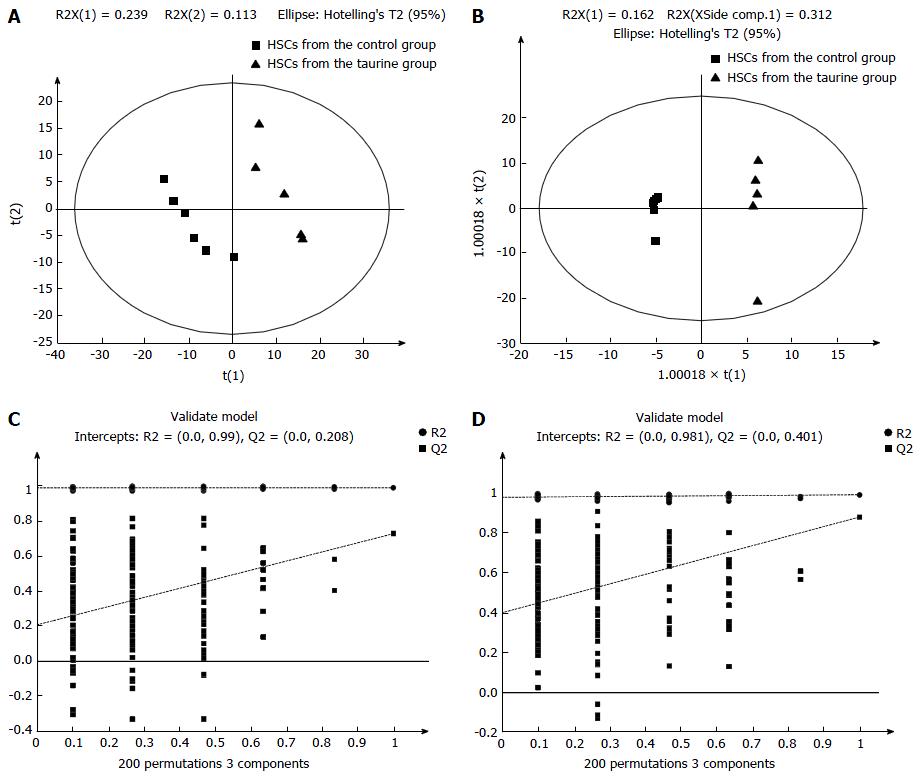
Figure 2 Partial least square discriminant analysis and validation of biological metabolites for taurine in hepatic stellate cells in electrosprayionization+ mode and in electrosprayionization- mode.
A: Partial least square discriminant analysis (PLS-DA) plots of biological metabolites for taurine in hepatic stellate cells (HSCs) in ESI+ mode; B: PLS-DA plots of biological metabolites for taurine in HSCs in ESI- mode; C: Validation of biological metabolites for taurine in HSCs in ESI+ mode; D: Validation of biological metabolites for taurine in HSCs in ESI- mode. ESI: Electrosprayionization; HSCs: Hepatic stellate cells.
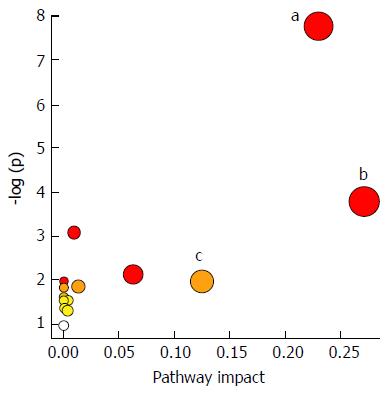
Figure 3 Potential pathways for taurine in hepatic stellate cells identified by using MetPA pathway analysis.
aSphingolipid metabolism pathway; bGlutathione metabolism pathway; cThiamine metabolism pathway.
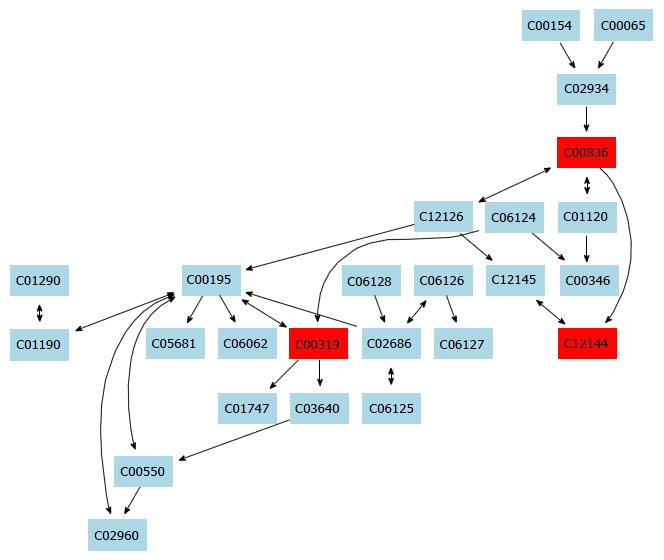
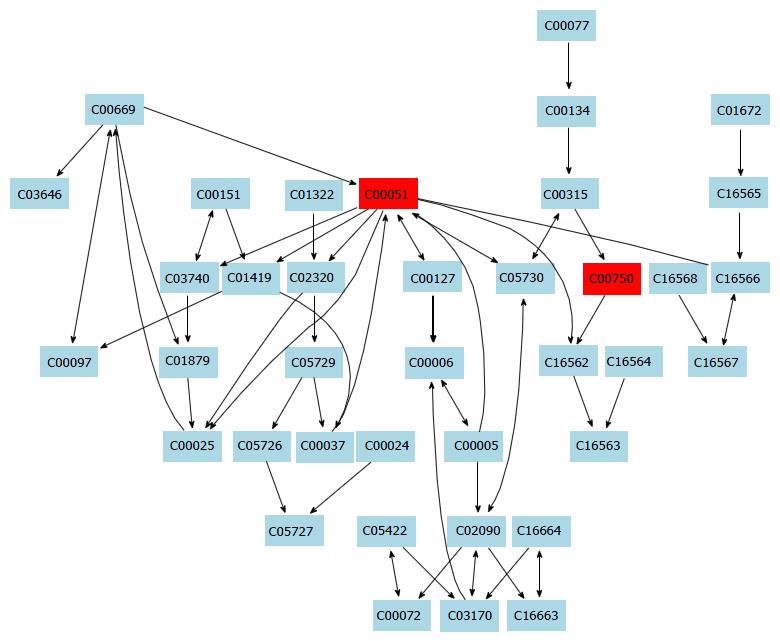
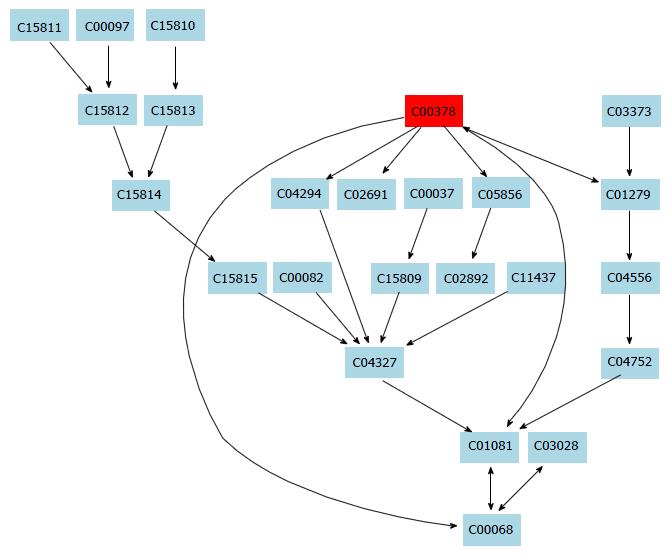
Figure 4 Sphingolipid metabolism pathway.
Figure 5 Glutathione metabolism pathway.
Figure 6 Thiamine metabolism pathway.
- Citation: Deng X, Liang XQ, Lu FG, Zhao XF, Fu L, Liang J. Metabolomic profiling for identification of metabolites and relevant pathways for taurine in hepatic stellate cells. World J Gastroenterol 2017; 23(31): 5713-5721
- URL: https://www.wjgnet.com/1007-9327/full/v23/i31/5713.htm
- DOI: https://dx.doi.org/10.3748/wjg.v23.i31.5713


