Copyright
©The Author(s) 2017.
World J Gastroenterol. Jun 28, 2017; 23(24): 4428-4436
Published online Jun 28, 2017. doi: 10.3748/wjg.v23.i24.4428
Published online Jun 28, 2017. doi: 10.3748/wjg.v23.i24.4428
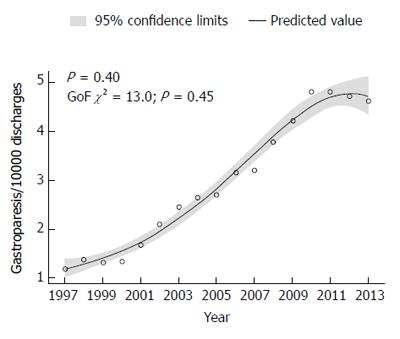
Figure 1 Rate of hospital discharges with primary diagnosis of gastroparesis.
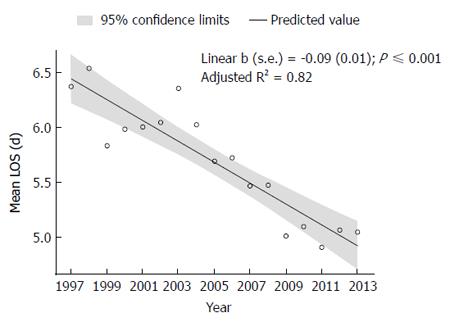
Figure 2 Average total length of stay per hospitalization due to gastroparesis.
LOS: Length of stay.
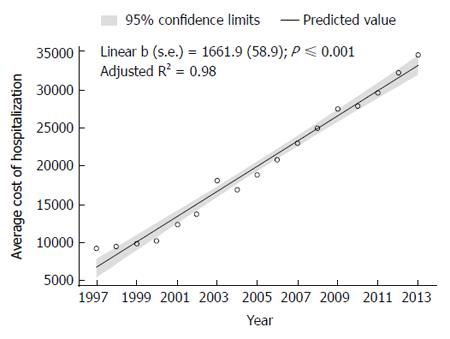
Figure 3 Average hospital charges per hospitalization due to gastroparesis.
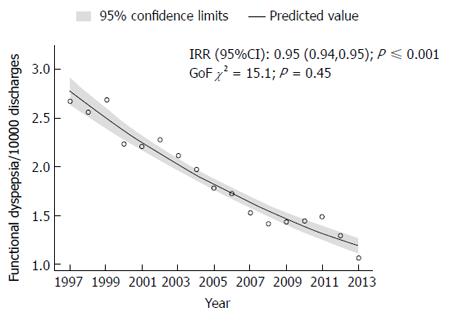
Figure 4 Rate of hospital discharges with primary diagnosis of functional dyspepsia.
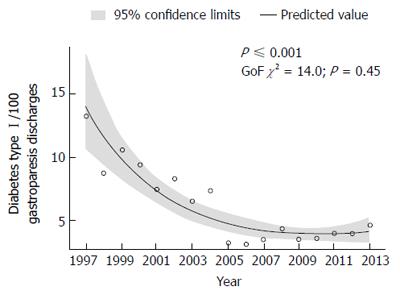
Figure 5 Rate of diabetes type I among hospitalizations with principal diagnosis of gastroparesis.
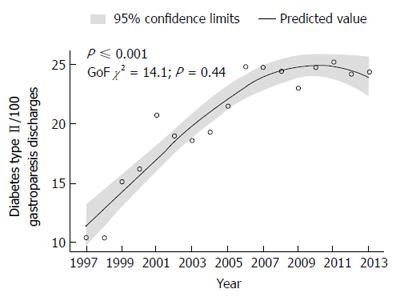
Figure 6 Rate of diabetes type II among hospitalizations with principal diagnosis of gastroparesis.
- Citation: Wadhwa V, Mehta D, Jobanputra Y, Lopez R, Thota PN, Sanaka MR. Healthcare utilization and costs associated with gastroparesis. World J Gastroenterol 2017; 23(24): 4428-4436
- URL: https://www.wjgnet.com/1007-9327/full/v23/i24/4428.htm
- DOI: https://dx.doi.org/10.3748/wjg.v23.i24.4428


