Copyright
©The Author(s) 2017.
World J Gastroenterol. May 7, 2017; 23(17): 3150-3162
Published online May 7, 2017. doi: 10.3748/wjg.v23.i17.3150
Published online May 7, 2017. doi: 10.3748/wjg.v23.i17.3150
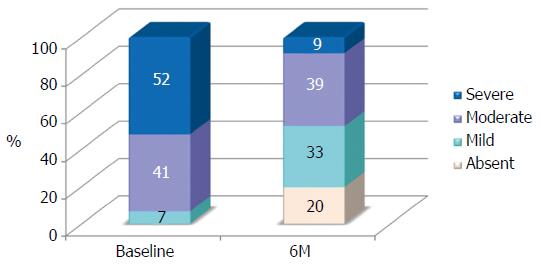
Figure 1 Steatosis grade of patients at baseline and end-treatment.
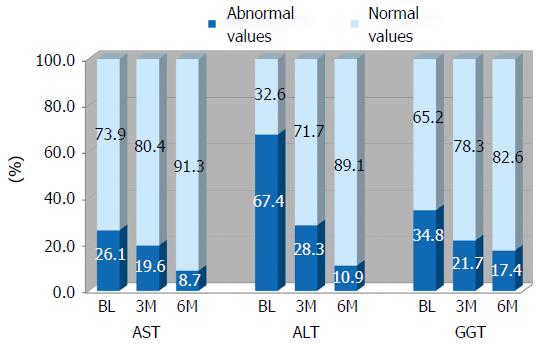
Figure 2 Effect of the treatment on the normalization of liver enzymes.
Normal values: < 40 U/L for AST, < 50 U/L for ALT, < 55 U/L for GGT. AST: Aspartate aminotransferase; ALT: Alanine aminotransferase; GGT: Gamma-glutamyl transferase.
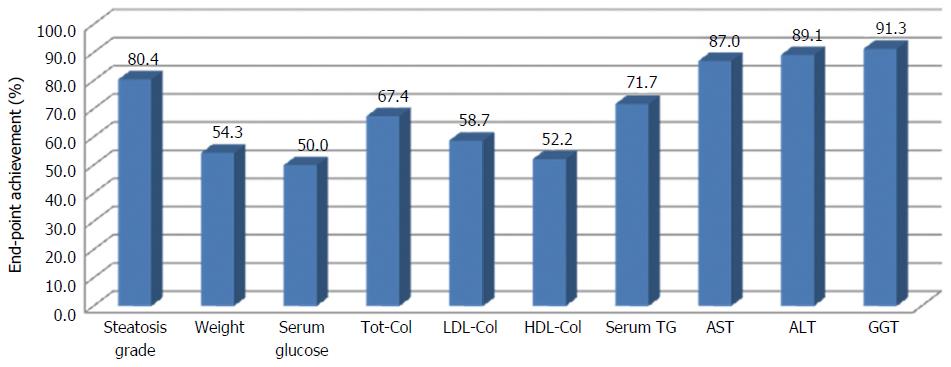
Figure 3 Grade of success for parameters and measures included in the end-points.
TG: Triglycerides; HDL: Highdensity lipoprotein; AST: Aspartate aminotransferase; ALT: Alanine aminotransferase; GGT: Gamma-glutamyl transferase.
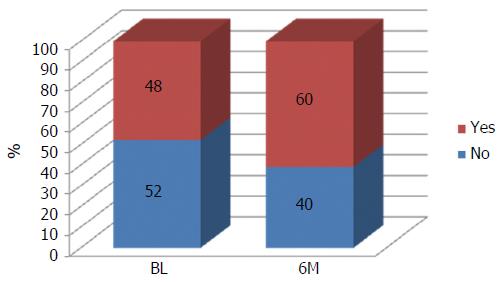
Figure 4 Percentage of participants carrying out physical activity on a regular basis at baseline and at end-intervention.
- Citation: Gelli C, Tarocchi M, Abenavoli L, Di Renzo L, Galli A, De Lorenzo A. Effect of a counseling-supported treatment with the Mediterranean diet and physical activity on the severity of the non-alcoholic fatty liver disease. World J Gastroenterol 2017; 23(17): 3150-3162
- URL: https://www.wjgnet.com/1007-9327/full/v23/i17/3150.htm
- DOI: https://dx.doi.org/10.3748/wjg.v23.i17.3150


