Copyright
©The Author(s) 2017.
World J Gastroenterol. Apr 7, 2017; 23(13): 2404-2413
Published online Apr 7, 2017. doi: 10.3748/wjg.v23.i13.2404
Published online Apr 7, 2017. doi: 10.3748/wjg.v23.i13.2404
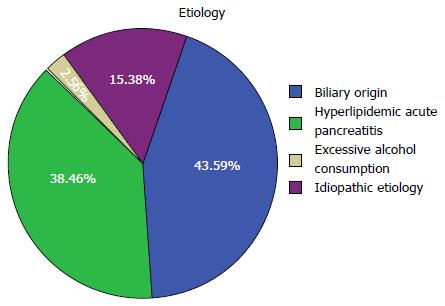
Figure 1 Distribution of acute pancreatitis patients according to etiology.
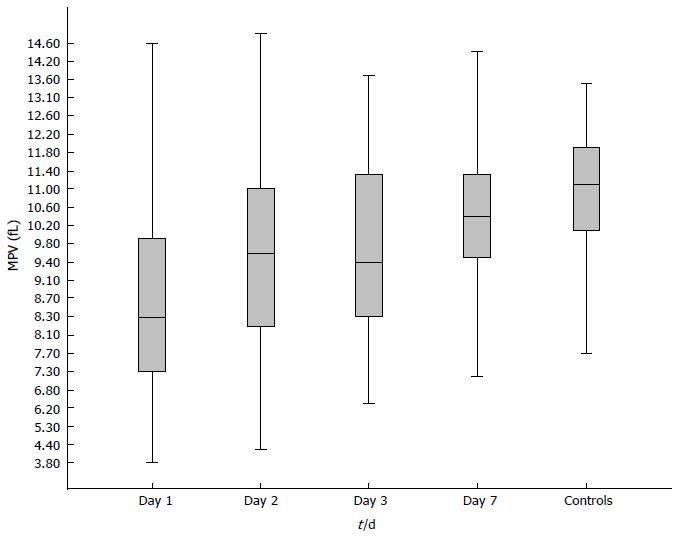
Figure 2 Mean platelet volume levels in acute pancreatitis patients (on days 1, 2, 3 and 7 after admission) and controls.
MPV: Mean platelet volume.
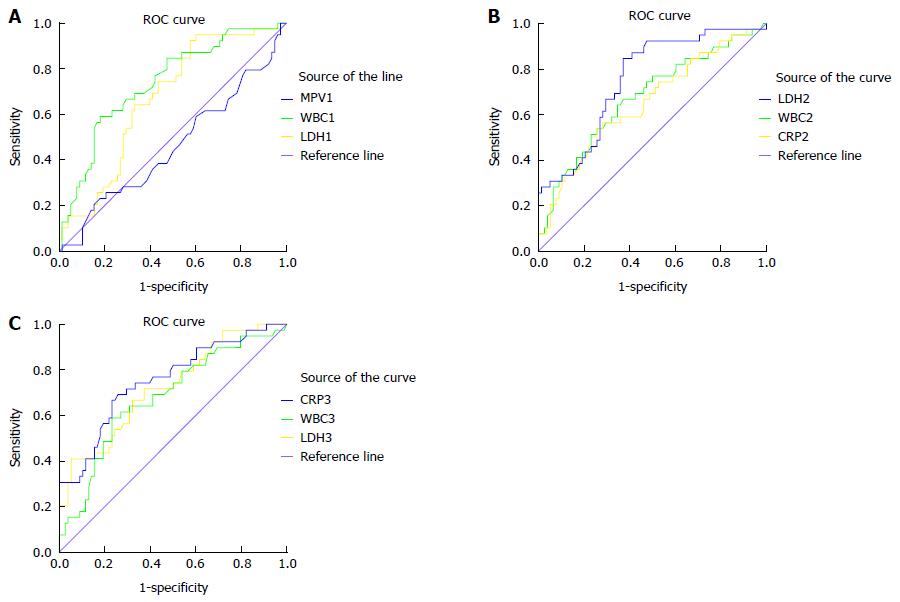
Figure 3 Receiver operating characteristic curves for mean platelet volume and other inflammation markers on days 1, 2 and 3 after admission for severe acute pancreatitis according to the Modified Glasgow Prognostic Score.
A: ROC curve for MPV and other inflammation markers on day 1 after admission; B: ROC curve for inflammation markers on day 2 after admission; C: ROC curve for inflammation markers on day 3 after admission.
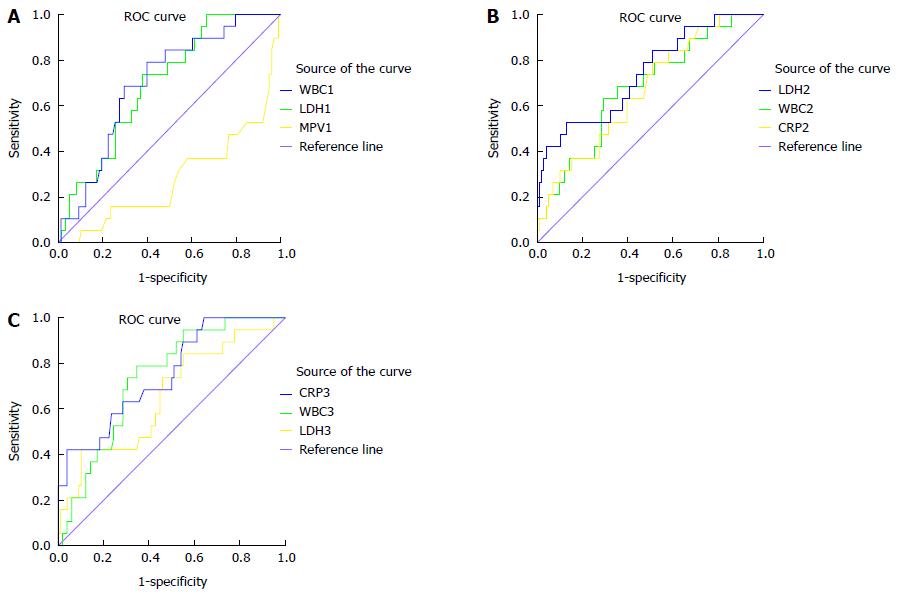
Figure 4 Receiver operating characteristic curves for mean platelet volume and other inflammation markers on days 1, 2 and 3 after admission for persistent organ failure according to the 2012 revised Atlanta criteria.
A: ROC for mean platelet volume (MPV) and other inflammation markers on day 1 after admission; B: ROC curve of inflammation markers on day 2 after admission; C: ROC curve of inflammation markers on day 3 after admission.
- Citation: Lei JJ, Zhou L, Liu Q, Xiong C, Xu CF. Can mean platelet volume play a role in evaluating the severity of acute pancreatitis? World J Gastroenterol 2017; 23(13): 2404-2413
- URL: https://www.wjgnet.com/1007-9327/full/v23/i13/2404.htm
- DOI: https://dx.doi.org/10.3748/wjg.v23.i13.2404


