Copyright
©The Author(s) 2017.
World J Gastroenterol. Mar 14, 2017; 23(10): 1857-1865
Published online Mar 14, 2017. doi: 10.3748/wjg.v23.i10.1857
Published online Mar 14, 2017. doi: 10.3748/wjg.v23.i10.1857
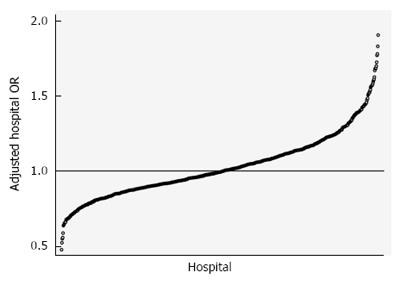
Figure 1 Variation in risk and reliability-adjusted mortality for cirrhosis admissions.
The 805 hospitals in the analysis demonstrated tremendously variable mortality risk, even after risk adjusting for clinical and demographic differences between patients and accounting for differences in the reliability of the estimate for a given hospital, which is driven by institutional cirrhosis volume. Cirrhosis mortality odds ratios ranged from nearly 50% lower than the average hospital to 200% higher for some hospitals.
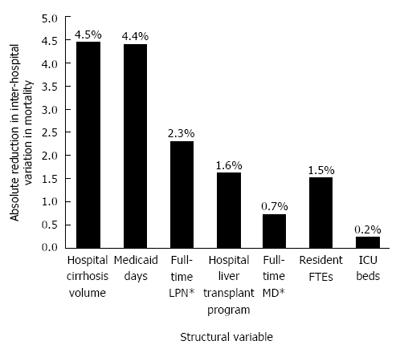
Figure 2 Inter-hospital variation in cirrhosis mortality explained by individual facility characteristics.
Across the 72733 cirrhosis admissions in 805 hospitals, the regression model including clinical risk adjustors, era effects, and facility characteristics explained approximately 15.3% of the total variation in cirrhosis mortality between hospitals. This figure demonstrates the specific hospital factors that additively accounted for this measured variation. Annual cirrhosis volume, case mix, nurse staffing, liver transplant services, and other facility characteristics accounted for this variation, but it is notable that the majority of variation between hospitals remains unexplained.
- Citation: Mathur AK, Chakrabarti AK, Mellinger JL, Volk ML, Day R, Singer AL, Hewitt WR, Reddy KS, Moss AA. Hospital resource intensity and cirrhosis mortality in United States. World J Gastroenterol 2017; 23(10): 1857-1865
- URL: https://www.wjgnet.com/1007-9327/full/v23/i10/1857.htm
- DOI: https://dx.doi.org/10.3748/wjg.v23.i10.1857


