Copyright
©The Author(s) 2017.
World J Gastroenterol. Mar 14, 2017; 23(10): 1787-1795
Published online Mar 14, 2017. doi: 10.3748/wjg.v23.i10.1787
Published online Mar 14, 2017. doi: 10.3748/wjg.v23.i10.1787
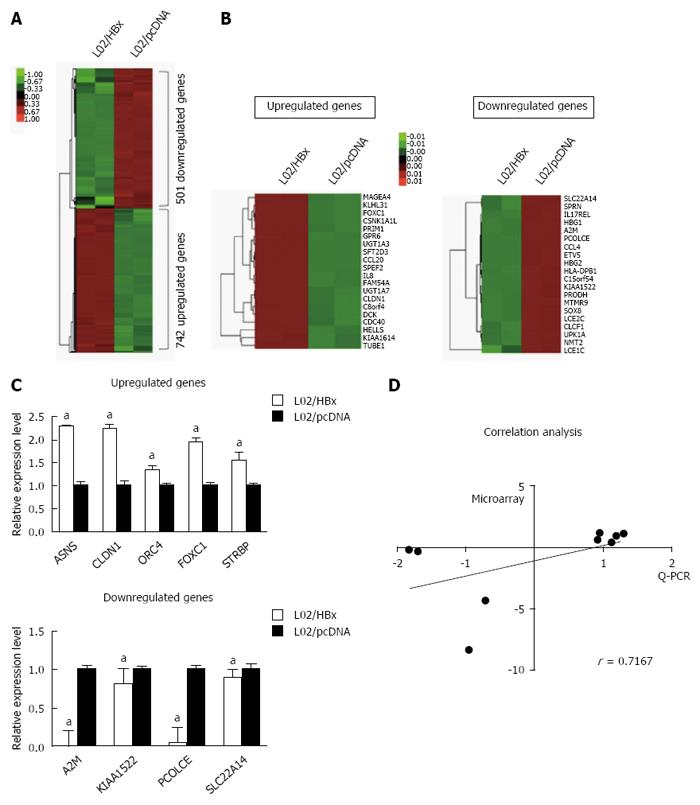
Figure 1 Differential mRNA expression between L02/HBx and L02/pcDNA cells.
A: The global expression profile of L02/HBx and L02/pcDNA cells was analyzed by RNA-sequencing analysis. Heat map shows the differential gene expression patterns (fold-change > 2 or P < 0.5); B: The 20 top-ranking upregulated (left) and downregulated (right) genes represented on a heat map; C: Quantitative real-time PCR (Q-PCR) verification of selected differential gene expression in L02/HBx and L02/pcDNA cells. The relative expression levels of these genes were normalized to GAPDH; D: Correlation analysis of mRNA expression data detected by microarray and Q-PCR respectively (P = 0.0369). aP < 0.05.
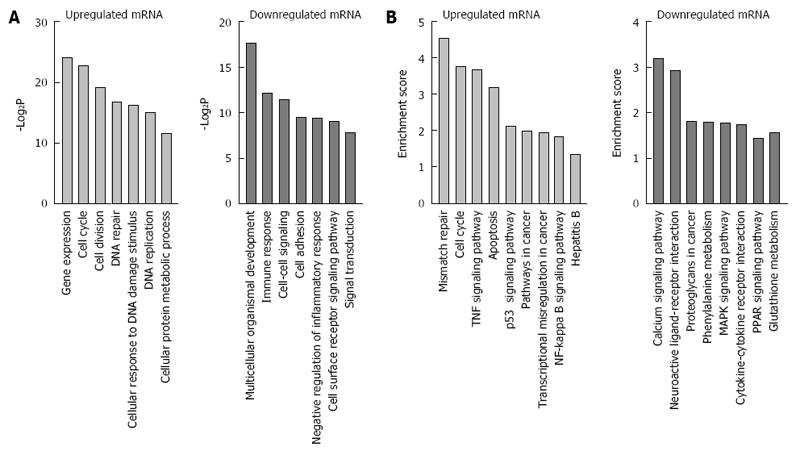
Figure 2 Gene ontology and Kyoto Encyclopedia of Genes and Genomes pathway analyses of differentially expressed mRNAs.
A: Gene ontology analysis of differentially expressed genes; B: Kyoto Encyclopedia of Genes and Genomes pathway analysis of differentially expressed genes.
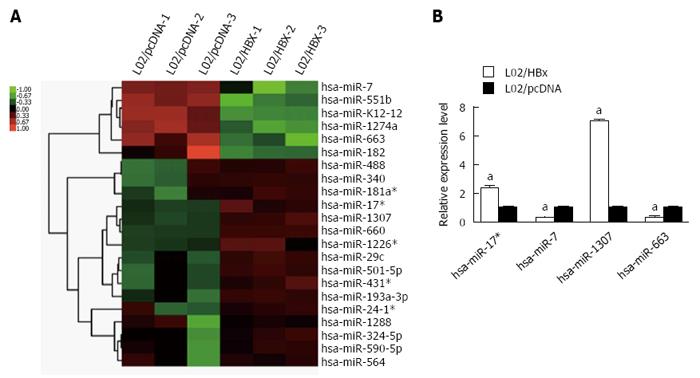
Figure 3 Differential miRNA expression between L02/HBx and L02/pcDNA cells.
A: Global analysis of differentially expressed miRNAs between L02/HBx and L02/pcDNA cells; B: The relative expression of 4 differentially expressed miRNAs determined by Q-PCR analysis. The relative expression levels of miRNAs were normalized to U6 RNA (aP < 0.05).
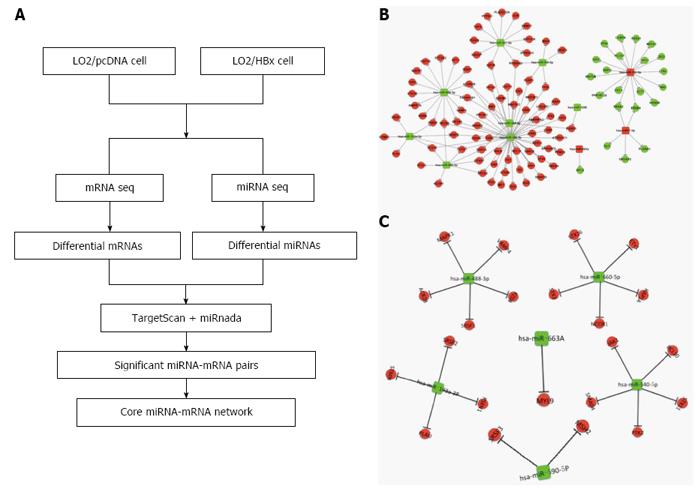
Figure 4 The miRNA-mRNA regulatory network in HBx-expressing cells.
A: The strategy for constructing the miRNA-mRNA network associated with HBx integration; B: Hub miRNA-target network associated with HBx integration determined by bioinformatics analysis; C: A core miRNA-mRNA network was constructed by integrating the expression change of predicted target genes in L02/HBx cells.
- Citation: Chen RC, Wang J, Kuang XY, Peng F, Fu YM, Huang Y, Li N, Fan XG. Integrated analysis of microRNA and mRNA expression profiles in HBx-expressing hepatic cells. World J Gastroenterol 2017; 23(10): 1787-1795
- URL: https://www.wjgnet.com/1007-9327/full/v23/i10/1787.htm
- DOI: https://dx.doi.org/10.3748/wjg.v23.i10.1787


