Copyright
©The Author(s) 2016.
World J Gastroenterol. Feb 28, 2016; 22(8): 2512-2523
Published online Feb 28, 2016. doi: 10.3748/wjg.v22.i8.2512
Published online Feb 28, 2016. doi: 10.3748/wjg.v22.i8.2512
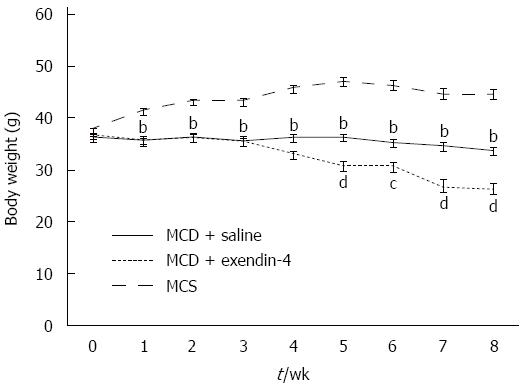
Figure 1 Time course changes in body weight of mice fed methionine-choline-sufficient diet (n = 6), methionine-choline-deficient diet with saline (n = 8), and methionine-choline-deficient diet with exendin-4 (n = 8).
Data are expressed as mean SE. (bP < 0.01, vs MCS, cP < 0.05, dP < 0.01, vs MCD with saline). MCD: Methionine-choline-deficient diet; MCS: Mice fed methionine-choline-sufficient diet .
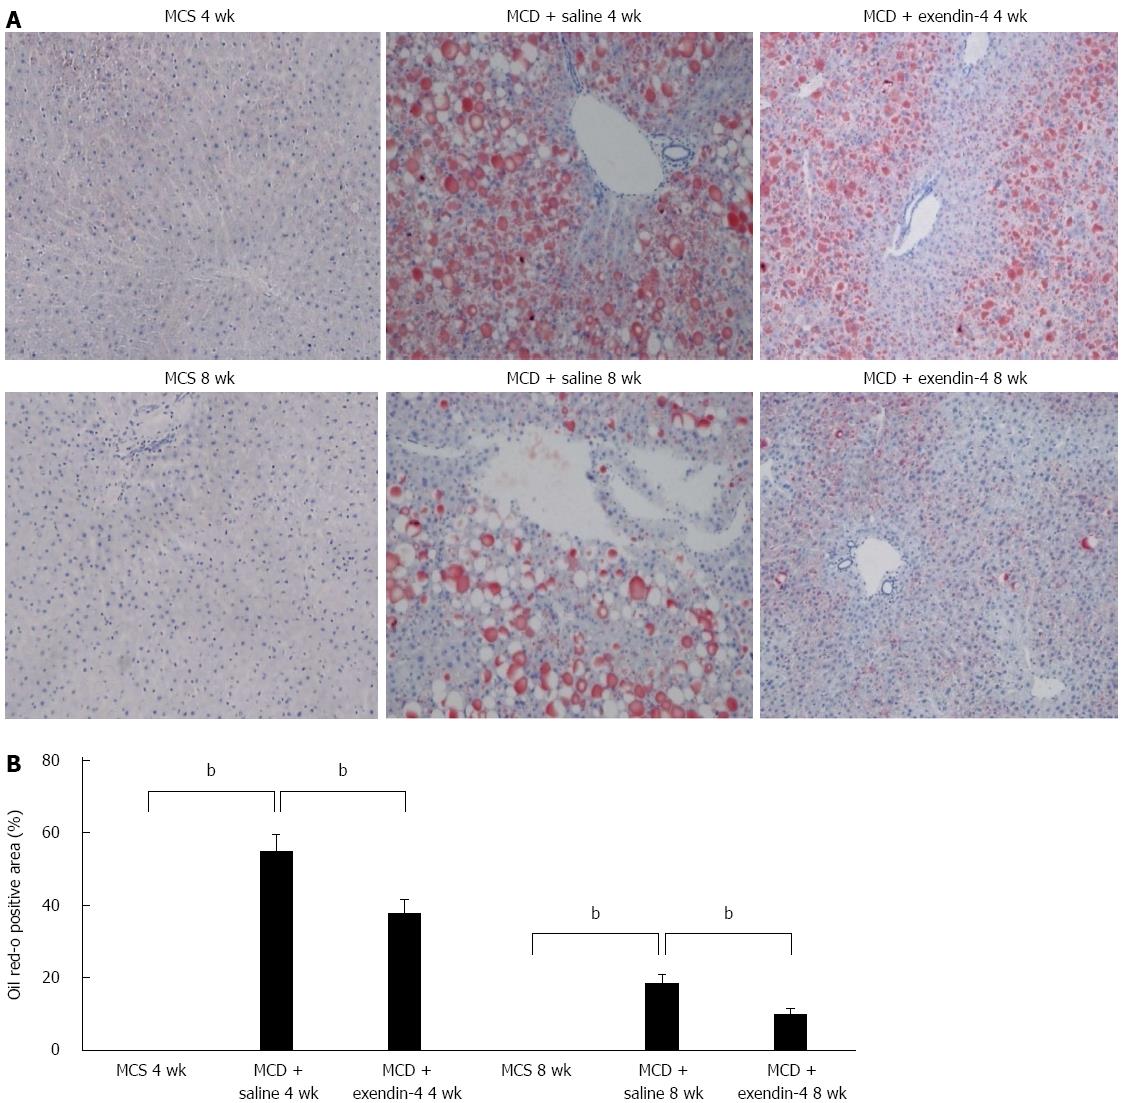
Figure 2 Evaluation of hepatic lipid contents of mice fed mice fed methionine-choline-sufficient diet, methionine-choline-deficient diet with exendin-4 or saline for 4 and 8 wk (A) and quantitative analysis of changes in Oil Red O positive area in respective groups (B).
Frozen liver sections were stained with Oil Red O. Data are expressed as mean ± SE. (bP < 0.01 vs respective groups). Original magnification, 100 ×. MCD: Methionine-choline-deficient diet; MCS: Mice fed methionine-choline-sufficient diet.
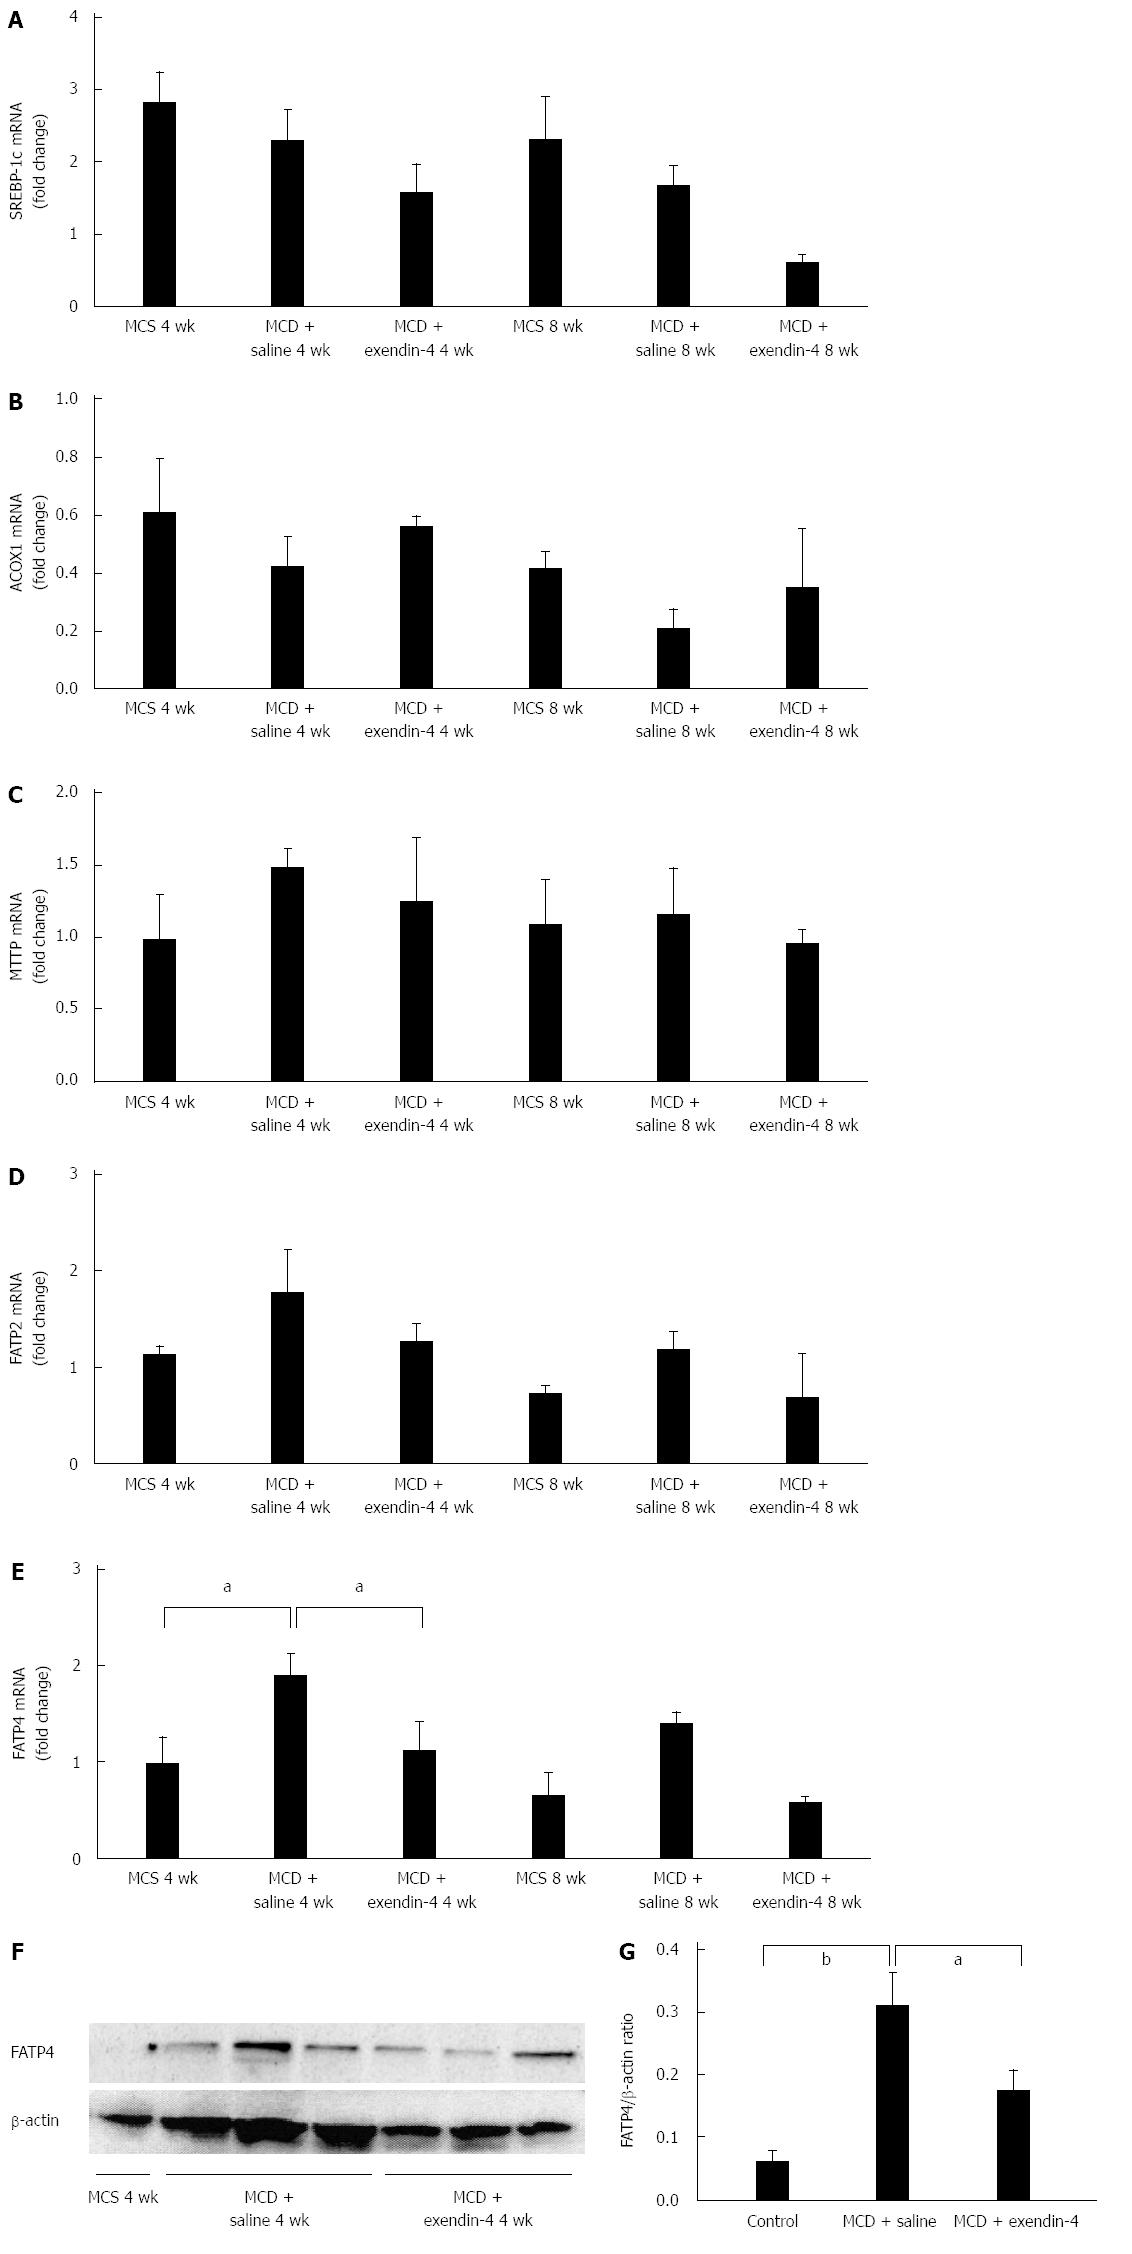
Figure 3 Evaluation of hepatic lipid metabolism-related genes of mice fed methionine-choline-sufficient diet, methionine-choline-deficient diet with exendin-4, or saline for 4 wk.
The relative mRNA expression of SREBP-1c (A), ACOX1 (B), MTTP (C), FATP2 (D) and FATP4 (E) were evaluated. Immunoblot of FATP4 protein expressions in the liver (F); To control for loading, the blot was stripped and reprobed for β-actin. FATP4 levels in each group, after a 4-wk treatment, were expressed relative to β-actin (G). Data are expressed as mean ± SE. (aP < 0.05, bP < 0.01 vs respective groups). MCD: Methionine-choline-deficient diet; MCS: Mice fed methionine-choline-sufficient diet; SREBP: Sterol regulatory element-binding protein; ACOX1: Acyl-coenzyme A oxidase 1; MTTP: Microsomal triglyceride transfer protein; FATP: Fatty acid transport protein.
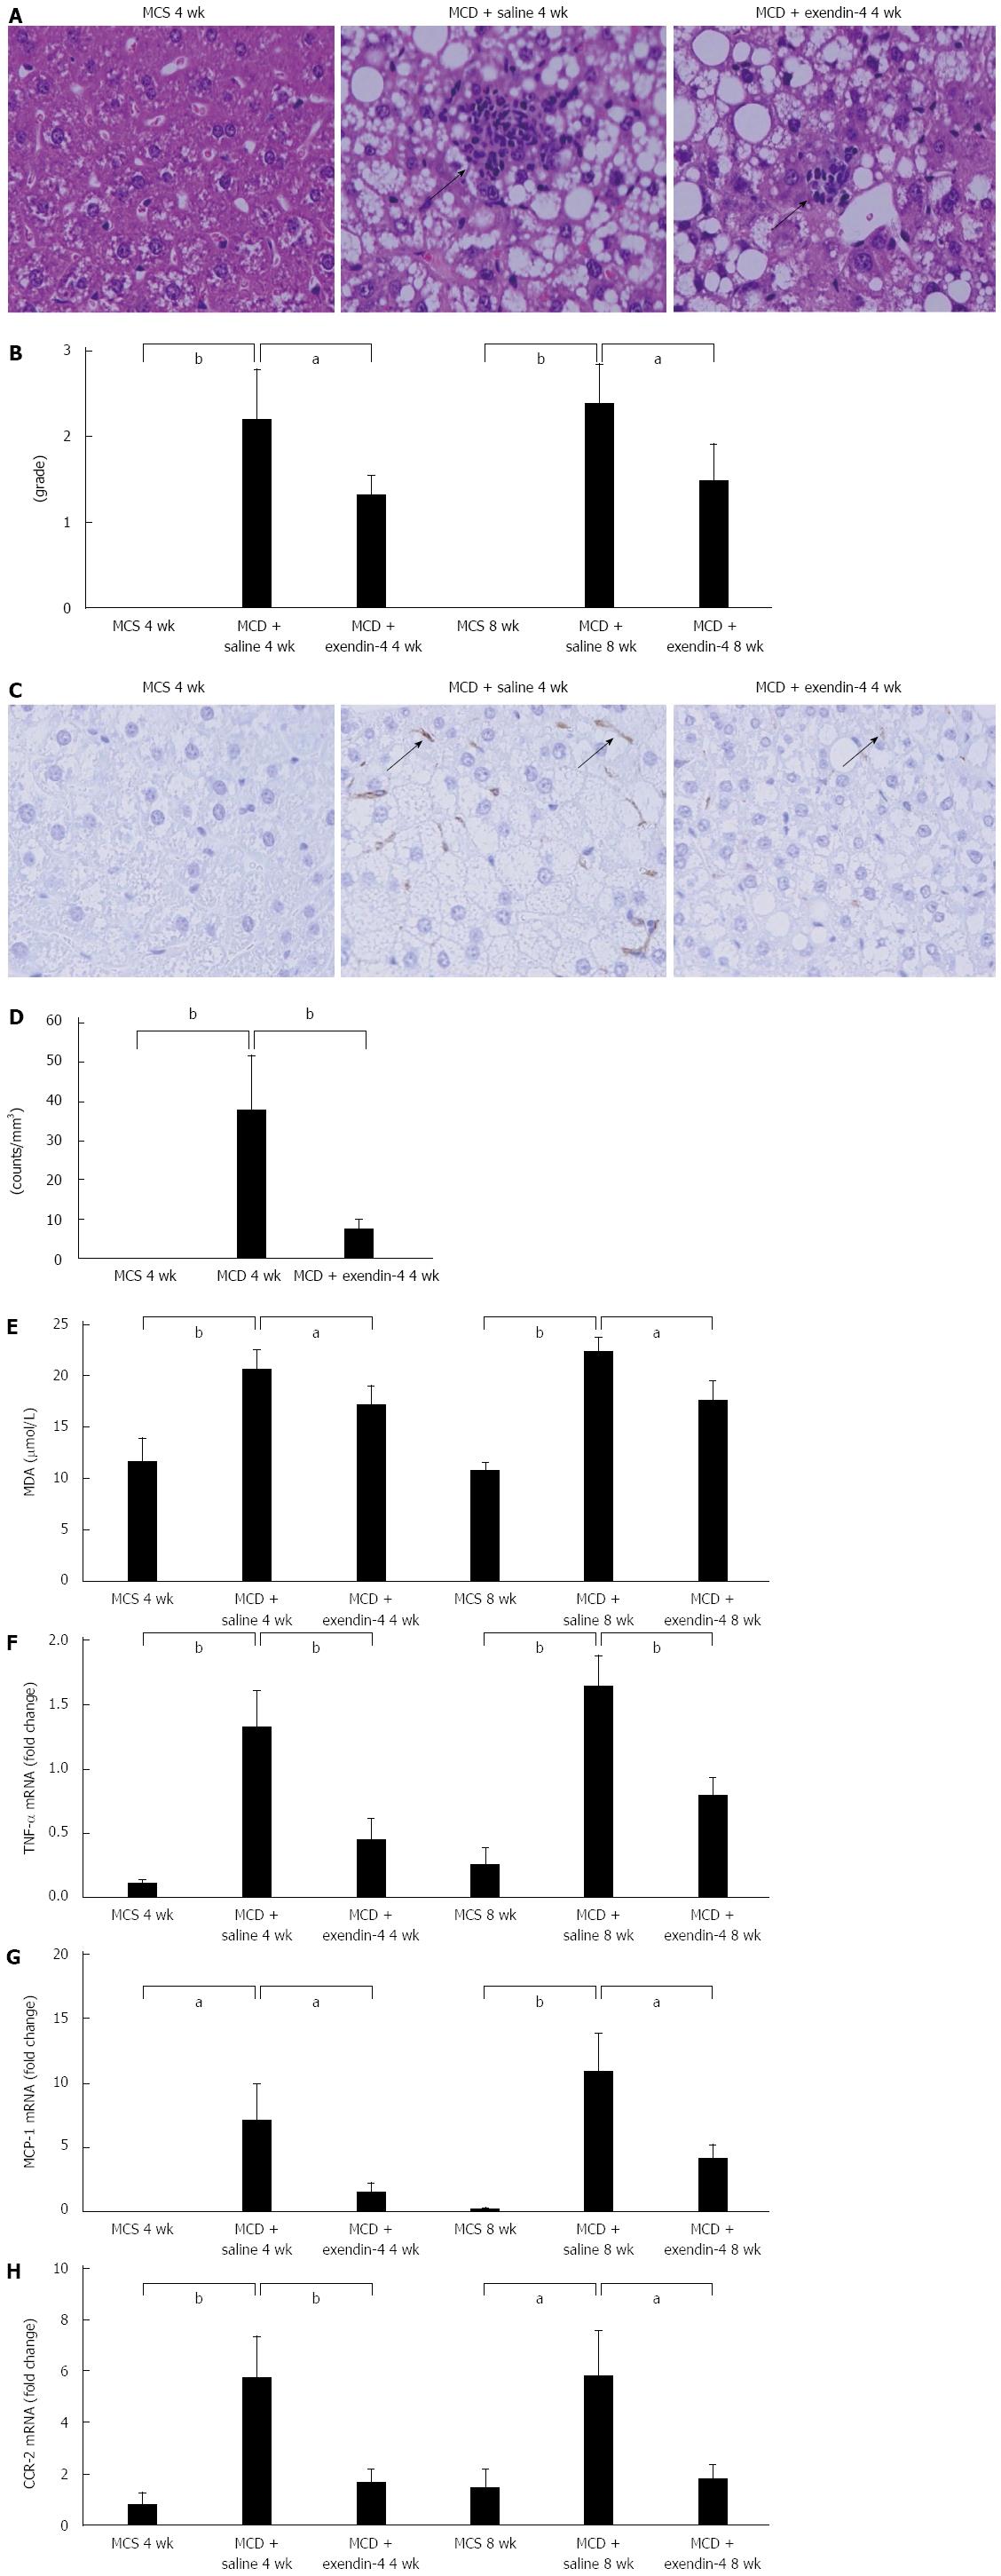
Figure 4 Evaluation of hepatic inflammation-related parameters of mice fed methionine-choline-sufficient diet, methionine-choline-deficient with exendin-4, or saline for 4 and 8 wk.
A: Representative images showing the inflammatory foci for MCD-induced liver injury at 4 wk. Original magnification, 200 ×; B: The number of inflammatory foci per 20 × field was enumerated on each section; C: Representative images of F4/80 immunoreactivity; positive cells are indicated by arrows. Original magnification, 200 ×; D: Quantitative analysis of changes in F4/80 positive cells in the respective groups; E: Evaluation of hepatic MDA levels and hepatic inflammation-related genes of mice fed MCS, MCD with exendin-4, or saline for 4 and 8 wk. Hepatic MDA levels, a marker of oxidative stress, were examined. Relative mRNA expression of TNF-α (F), MCP-1 (G), and CCR-2 (H) was evaluated in the liver. Data are expressed as mean ± SE. (aP < 0.05, bP < 0.01, vs respective groups). MCD: Methionine-choline-deficient diet; MCS: Mice fed methionine-choline-sufficient diet ; MDA: Malondialdehyde; TNF-α: Tumor necrosis factor-α; MCP-1: Monocyte chemotactic protein-1; CCR-2: cc-chemokine receptor 2.
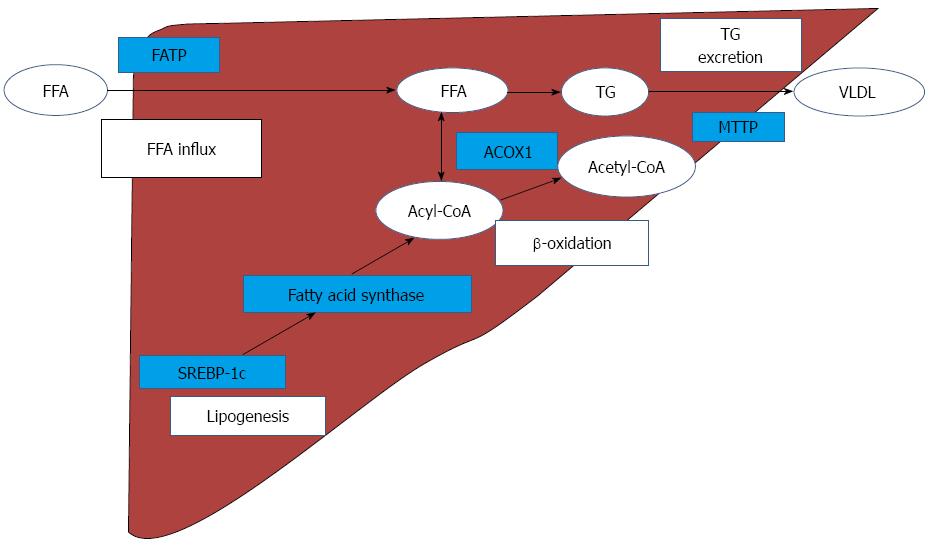
Figure 5 Predicted mechanism of hepatic lipid metabolism on methionine-choline-deficient diet-induced nonalcoholic steatohepatitismodel.
MCD increases FATP in the liver and hepatic FFA contents are increased. SREBP-1c modulates fatty acid synthase, and facilitates hepatic de novo lipogenesis. Fatty acid synthase produces Acyl-CoA which is catalyzed by ACOX1 in β-oxidation. Accumulated FFA is stored in hepatocytes as TG, and hepatic TG are excreted by MTTP, as VLDL. MCD: Methionine-choline-deficient diet; FATP: Fatty acid transport protein; FFA: Free fatty acid; SREBP-1c: Sterol regulatory element-binding protein-1c; ACOX1: Acyl-coenzyme A oxidase 1; TG: Triglyceride; MTTP: Microsomal triglyceride transfer protein; VLDL: Very low density lipoprotein.
- Citation: Yamamoto T, Nakade Y, Yamauchi T, Kobayashi Y, Ishii N, Ohashi T, Ito K, Sato K, Fukuzawa Y, Yoneda M. Glucagon-like peptide-1 analogue prevents nonalcoholic steatohepatitis in non-obese mice. World J Gastroenterol 2016; 22(8): 2512-2523
- URL: https://www.wjgnet.com/1007-9327/full/v22/i8/2512.htm
- DOI: https://dx.doi.org/10.3748/wjg.v22.i8.2512


