Copyright
©The Author(s) 2016.
World J Gastroenterol. Dec 21, 2016; 22(47): 10325-10340
Published online Dec 21, 2016. doi: 10.3748/wjg.v22.i47.10325
Published online Dec 21, 2016. doi: 10.3748/wjg.v22.i47.10325
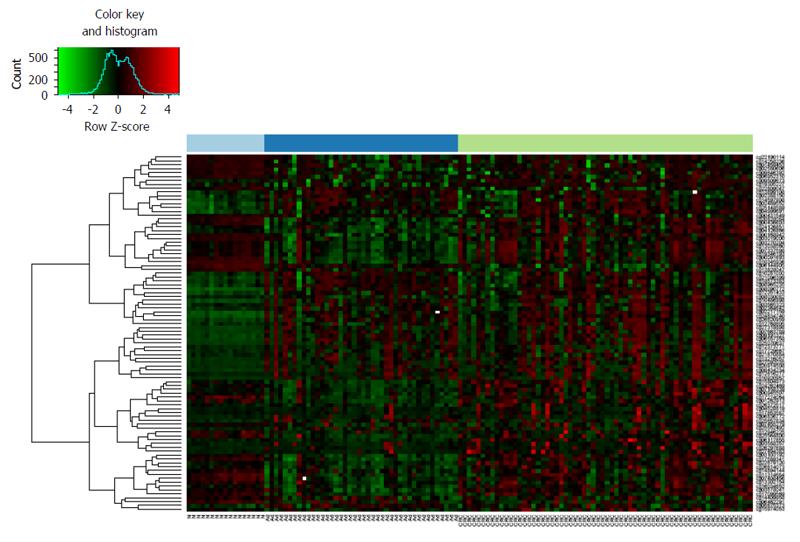
Figure 1 DNA methylation heatmap of normal, adenoma and colorectal carcinoma samples according to the methylation status of age-related CpG sites.
From the 353 epigenetic clock CpG sites (cg IDs)[2] significantly differentially methylated in CRC vs normal, adenoma vs normal and CRC vs adenoma comparisons were selected and colonic tissue samples (GSE48684[24]) were classified according to their methylation levels. The analyzed samples are illustrated on X axis, significantly altered CpG sites (cg IDs) are represented on Y axis. DNA methylation intensities (β values) are visualized, red shows hypermethylation, while hypomethylation was marked with green color. CRC: Colorectal carcinoma (light green); Ad: Adenoma (dark blue); N: Normal (light blue).
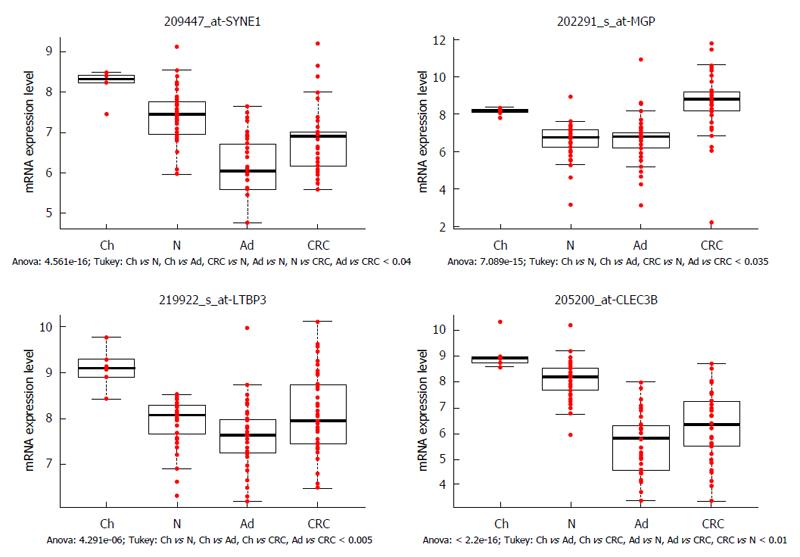
Figure 2 Genes showing both age- and carcinogenesis-related expression alterations.
SYNE1 (spectrin repeat containing nuclear envelope protein 1), LTBP3 (latent transforming growth factor beta binding protein 3) and CLEC3B (C-type lectin domain family 3 member B) genes were downregulated during the colorectal carcinogenesis, similar decreasing expression was found during aging (significantly higher mRNA levels were detected in young colonic samples than in healthy adult biopsy specimens). MGP (matrix Gla protein) was overexpressed in children and in CRC samples compared to adenoma and healthy adults (P < 0.035), hence its opposite expression was found during aging and colorectal carcinogenesis. X axis shows the analyzed sample groups, the normalized mRNA expression can be seen on Y axis. Red dots indicate the normalized mRNA expression values, boxplots represent the medians and standard deviations. Ch: Children; N: Normal; Ad: Adenoma; CRC: Colorectal cancer.
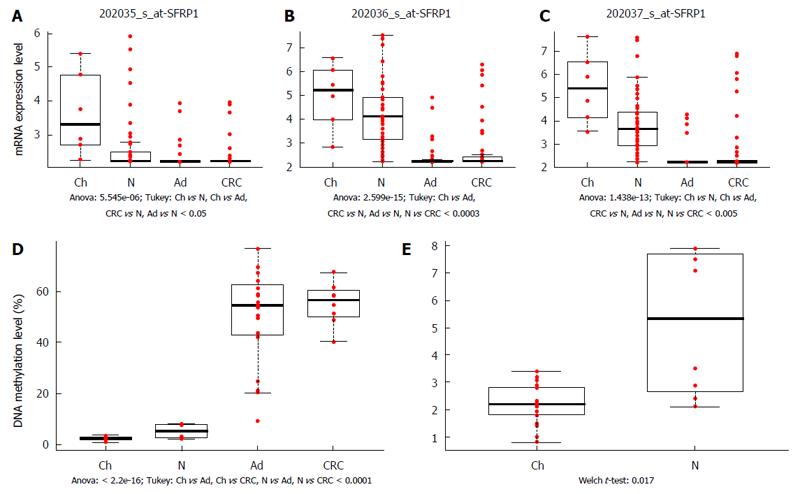
Figure 3 SFRP1 mRNA expression and promoter DNA methylation alterations during aging and in different stages of colorectal carcinogenesis.
SFRP1 mRNA expression was significantly downregulated in adenoma and CRC samples compared to normal controls in case of all three Affymetrix probeset IDs representing SFRP1 [202035_s_at: P < 0.05 (A); 202036_s_at: P < 0.0003 (B); 202037_s_at: P < 0.005 (C)]. In colonic biopsy samples of healthy young patients, higher SFRP1 mRNA levels could be measured than in normal adults samples, this overexpression was proven to be significant in two of three transcript IDs [202035_s_at: P < 0.05 (A); 202037_s_at: P < 0.005 (C)]. SFRP1 promoter region was significantly hypermethylated in CRC and adenoma tissue samples compared to normal adult and young colonic tissue (P < 0.0001) (D). In pairwise comparison, DNA methylation of SFRP1 promoter was slightly, but significantly increased in healthy adults compared to normal young samples (P < 0.02) (E). The analyzed sample groups are illustrated on X axis, the normalized mRNA expression (A, B, C) and percentage of SFRP1 promoter methylation (D, E) are represented on Y axis. Red dots indicate the normalized mRNA expression values (A, B, C) and the normalized DNA methylation percentage values (D, E), respectively. Boxplots represent the medians and standard deviations. Ch: Children; N: Normal; Ad: Adenoma; CRC: Colorectal cancer.
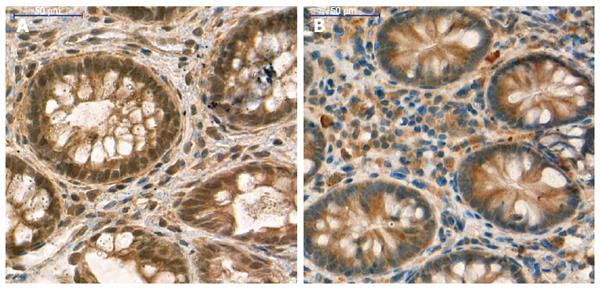
Figure 4 SFRP1 protein expression in colonic tissue samples of healthy normal children and adults.
Strong/moderate cytoplasmic and nuclear SFRP1 expression both in epithelial and stromal compartments of healthy children (A) and healthy adult (B) samples. Digital microscopic images; magnification × 40; scale: 50 μm.
- Citation: Galamb O, Kalmár A, Barták BK, Patai &V, Leiszter K, Péterfia B, Wichmann B, Valcz G, Veres G, Tulassay Z, Molnár B. Aging related methylation influences the gene expression of key control genes in colorectal cancer and adenoma. World J Gastroenterol 2016; 22(47): 10325-10340
- URL: https://www.wjgnet.com/1007-9327/full/v22/i47/10325.htm
- DOI: https://dx.doi.org/10.3748/wjg.v22.i47.10325


