Copyright
©The Author(s) 2016.
World J Gastroenterol. Nov 7, 2016; 22(41): 9104-9116
Published online Nov 7, 2016. doi: 10.3748/wjg.v22.i41.9104
Published online Nov 7, 2016. doi: 10.3748/wjg.v22.i41.9104
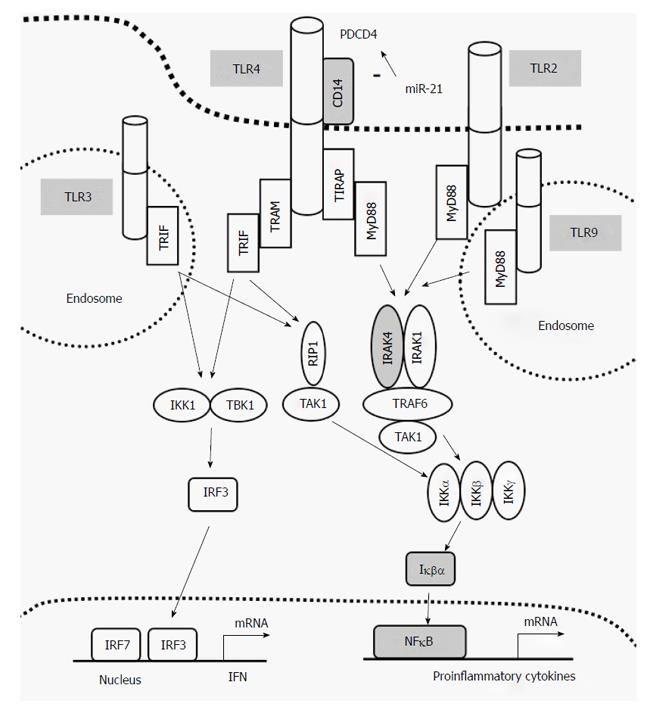
Figure 1 Toll-like receptor signalling pathway.
TLR: Toll-like receptor.
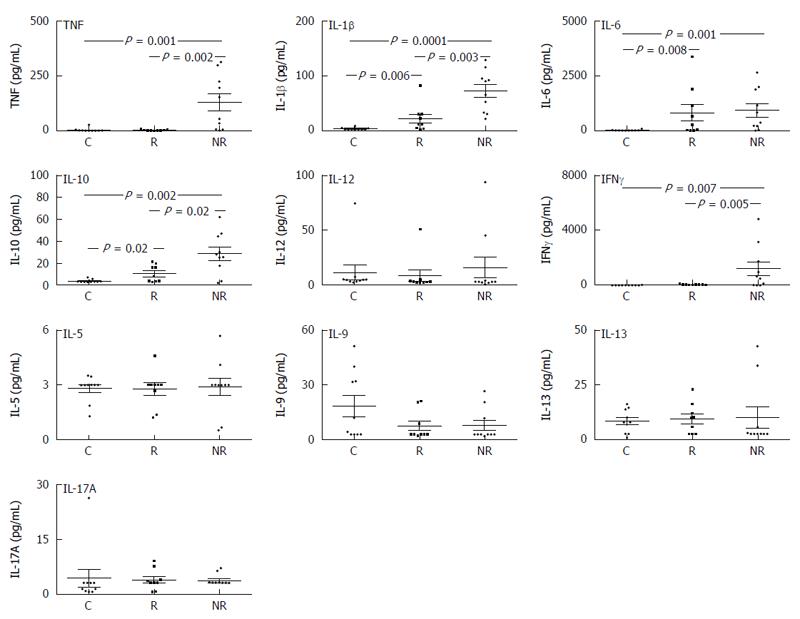
Figure 2 Basal cytokine production in responders and non-responders compared to healthy controls.
The basal expression of pro-inflammatory (TNF, IL-1β, IL-6), regulatory (IL-10), Th1 (IL-12, IFNγ) and Th2 (IL-5, -9, -13, 17A) cytokines were assessed and compared in peripheral blood mononuclear cells isolated from healthy controls (C) (n = 12) and UC patients who are in remission following anti-TNF therapy, responders (R) (n = 12) and those who failed to respond, non-responders (NR) (n = 12). Results were expressed as mean with 95%CI. The P values represent statistical significance of < 0.05 between the groups denoted. TNF: Tumor necrosis factor; IL: Interleukin.
Figure 3 Toll-like receptor-induced tumour necrosis factor, interleukin-1β, -6 and -10 in responders and non-responders compared to healthy controls.
The differences in basal and stimulated (A) TNF, (B) IL-1β, (C) IL-6 and (D) IL-10 production in PBMCs post TLR stimulation. Results were calculated and expressed as fold-change from baseline (± SD). The P values represent statistical significance of < 0.05 between the groups as denoted. PBMC: Peripheral blood mononuclear cells; TLR: Toll-like receptor; TNF: Tumor necrosis factor; IL: Interleukin.
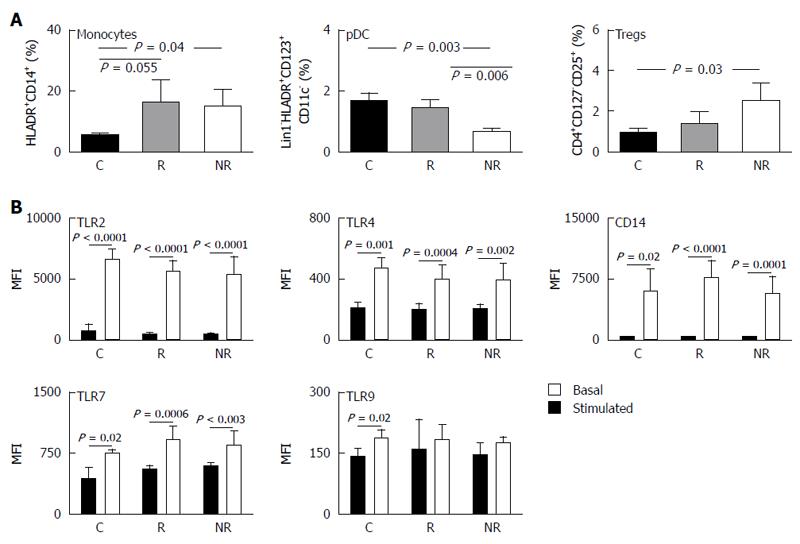
Figure 4 Peripheral blood mononuclear cells phenotype and toll-like receptor /CD14 protein levels in responders and non-responders compared to healthy controls.
A: Percentage of monocytes, pDC and CD4+ regulatory T cells were determined from total population of PBMCs isolated from responders (R, n = 12), non-responders (NR, n = 12) and healthy controls (C, n = 12) by FACS analysis. Data are expressed as mean percentage (± SD) of total cell population; B: Basal (black columns) and stimulated (white columns) TLR2, TLR4, TLR7, TLR9 and CD14 protein levels in PBMCs isolated from C (n =12), R (n =12) and NR (n = 12) were assessed by surface and intracellular staining followed by FACS analysis. Data are expressed as mean fluorescence intensity (MFI ± SD). The P values represent statistical significance of < 0.05 between the groups as denoted. PBMC: Peripheral blood mononuclear cells; TLR: Toll-like receptor; pDC: Plasmacytoid dendritic cells.
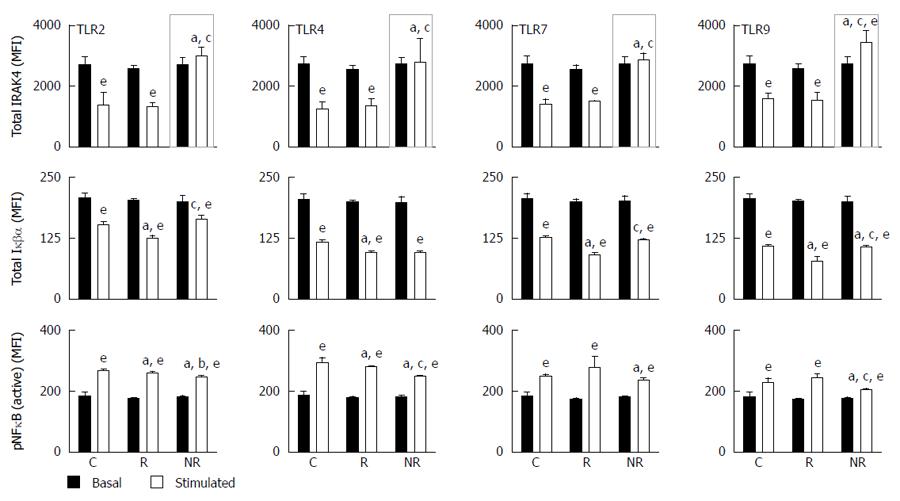
Figure 5 Basal and stimulated toll-like receptor signalling pathways in responders and non-responders compared to healthy controls.
PBMCs isolated from responders (R, n = 12), non-responders (NR, n = 12) and healthy controls (C, n = 12) were stimulated with TLR2, TLR4, TLR7 or TLR9 agonists for 24-48 h prior to intracellular staining for total IRAK4 (top), total Iκβα (middle) and phosphorylated (activated) NFκB (pNFκβ) (bottom) followed by FACS analysis. Data are expressed as MFI ± SD. aP < 0.05 vs stimulated healthy control C (white open bars); cP < 0.05 compared to stimulated responders (white open bars); eP < 0.05 compared to basal (black solid bars). Grey open boxes represent differences in total IRAK4 expression compared to responders and controls. PBMC: Peripheral blood mononuclear cells; TLR: Toll-like receptor; NFκB: Nuclear factor kappa B; Iκβα: Inhibitor of NFκB.
- Citation: Baird AC, Mallon D, Radford-Smith G, Boyer J, Piche T, Prescott SL, Lawrance IC, Tulic MK. Dysregulation of innate immunity in ulcerative colitis patients who fail anti-tumor necrosis factor therapy. World J Gastroenterol 2016; 22(41): 9104-9116
- URL: https://www.wjgnet.com/1007-9327/full/v22/i41/9104.htm
- DOI: https://dx.doi.org/10.3748/wjg.v22.i41.9104


