Copyright
©The Author(s) 2016.
World J Gastroenterol. Oct 28, 2016; 22(40): 8929-8939
Published online Oct 28, 2016. doi: 10.3748/wjg.v22.i40.8929
Published online Oct 28, 2016. doi: 10.3748/wjg.v22.i40.8929
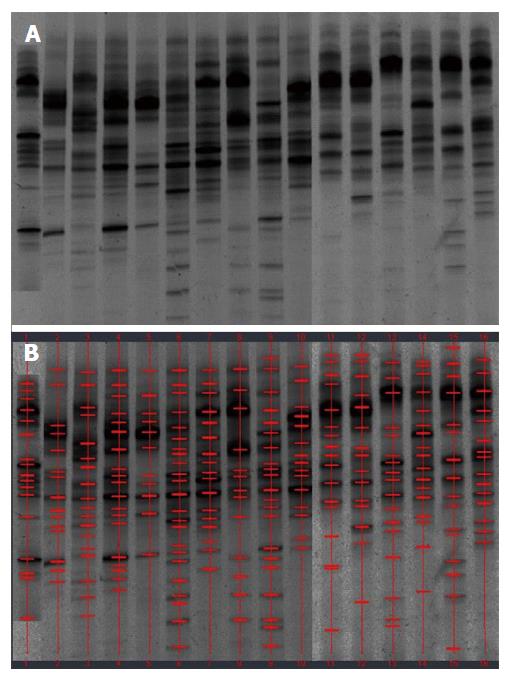
Figure 1 Denaturing gradient gel electrophoresis profiles of fecal samples from healthy controls.
A: Denaturing gradient gel electrophoresis (DGGE) profiles; B: Marked DGGE profiles. DGGE bands showed relative stability among different individuals.
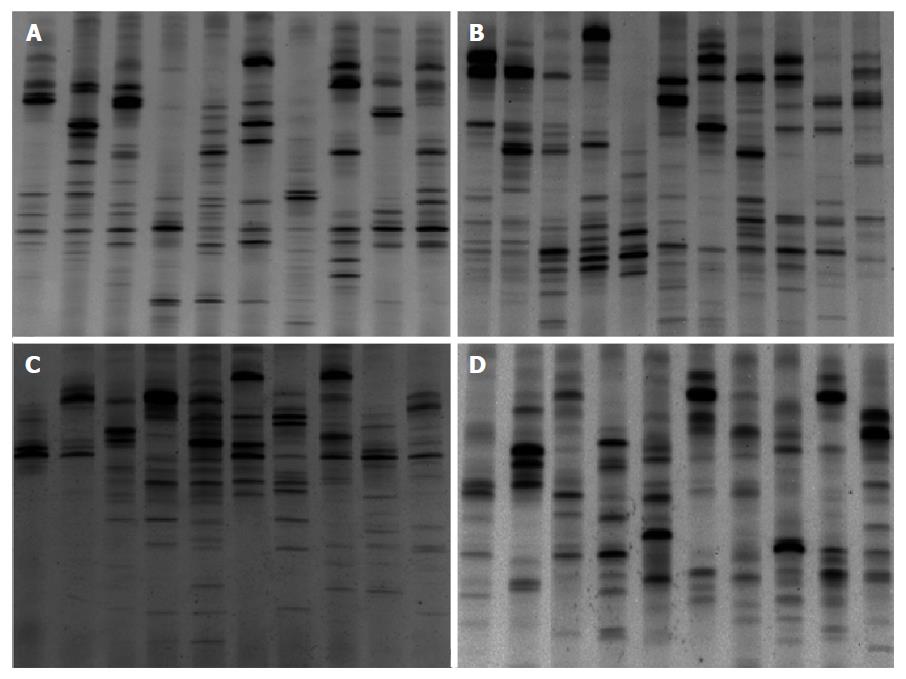
Figure 2 Denaturing gradient gel electrophoresis profiles showed microbial biodiversity in different ulcerative colitis groups.
A: Ulcerative colitis (UC) patients in remission; B: UC patients in the mildly active stage; C: UC patients in the moderately active stage; D: UC patients in the severely active stage.
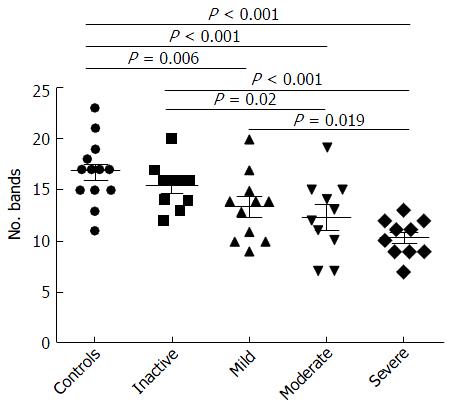
Figure 3 Number of bands in denaturing gradient gel electrophoresis profiles of samples obtained from 41 ulcerative colitis patients.
The number of bands decreased significantly from healthy controls to severe ulcerative colitis.
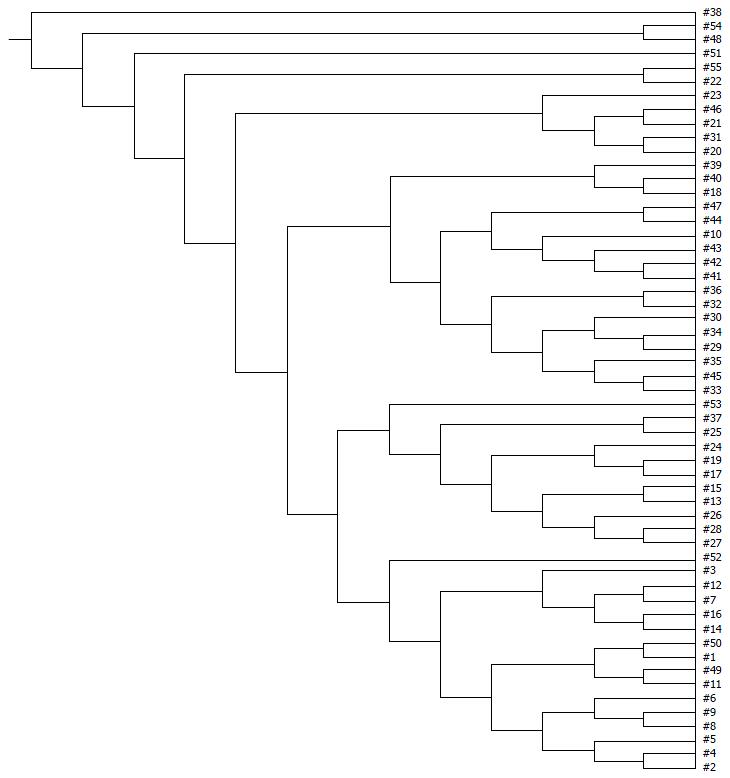
Figure 4 UPGMA tree analysis of healthy controls and ulcerative colitis patients at different stages.
1-16: Healthy controls; 17-26: Ulcerative colitis (UC) patients in remission; 27-37: UC patients in the mildly active stage; 38-47: UC patients in the moderately active stage; 48-57: UC patients in the severely active stage. UPGMA tree analysis showed a significant difference among groups of healthy controls and UC patients at different stages.
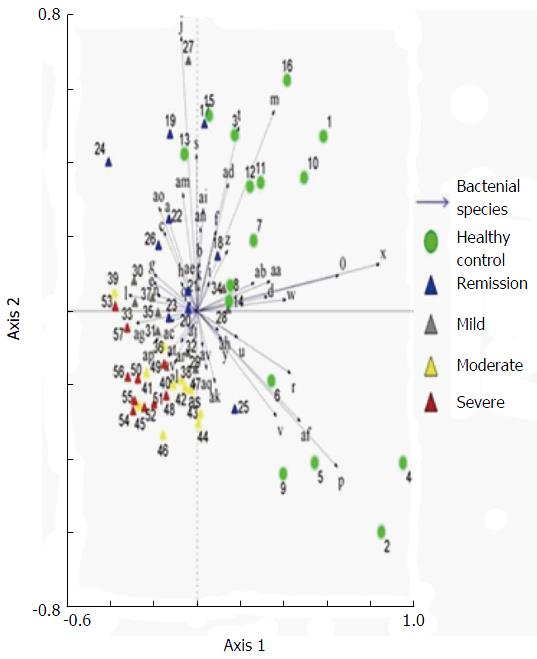
Figure 5 Principal component analysis of denaturing gradient gel electrophoresis microbial profiles in fecal samples of healthy controls and ulcerative colitis patients at different stages.
Clustering of similar microbial profiles showed systematic differences among different groups.
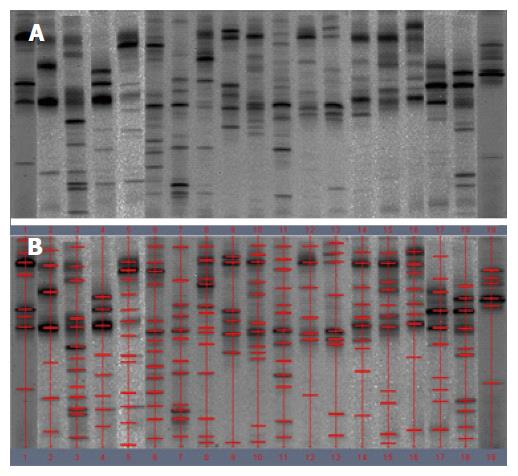
Figure 6 Denaturing gradient gel electrophoresis profiles of fecal samples from patients with pouchitis.
A: Denaturing gradient gel electrophoresis (DGGE) profiles; B: Marked DGGE profiles. DGGE bands revealed the relative stability of the microbiota in pouchitis group.
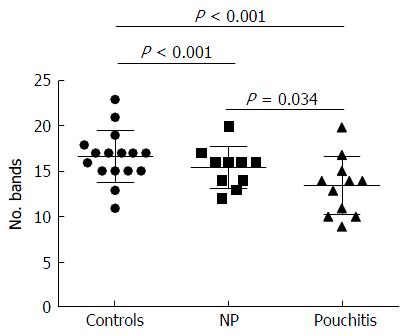
Figure 7 Number of bands in denaturing gradient gel electrophoresis profiles of samples obtained from patients receiving surgery.
The number of bands was reduced significantly in pouchitis compared with the control group and the no pouchitis (NP) group.
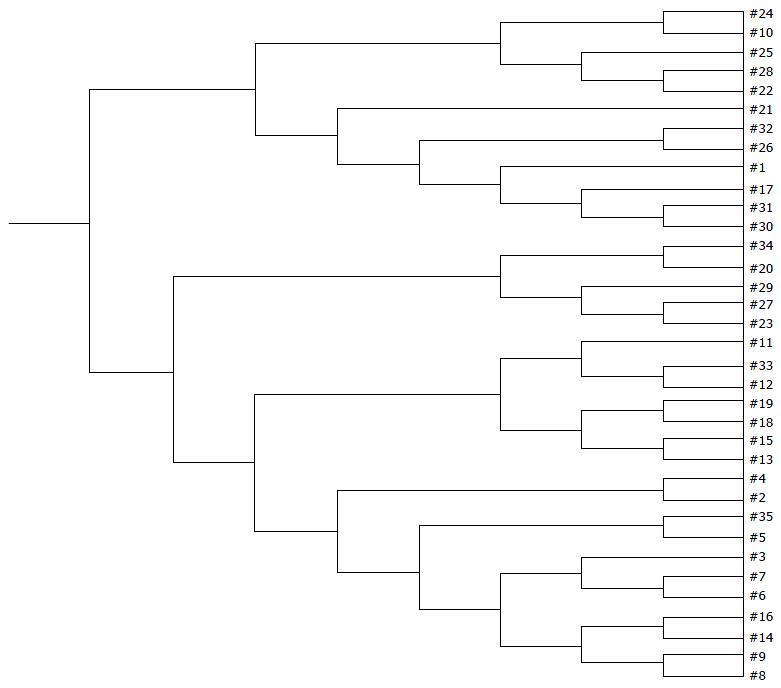
Figure 8 UPGMA tree analysis of healthy controls and postoperative patients.
1-16: Healthy controls; 17-27: UC patients without pouchitis after IPAA; 28-35: Patients with pouchitis. UPGMA tree analysis showed a significant difference among the three groups.
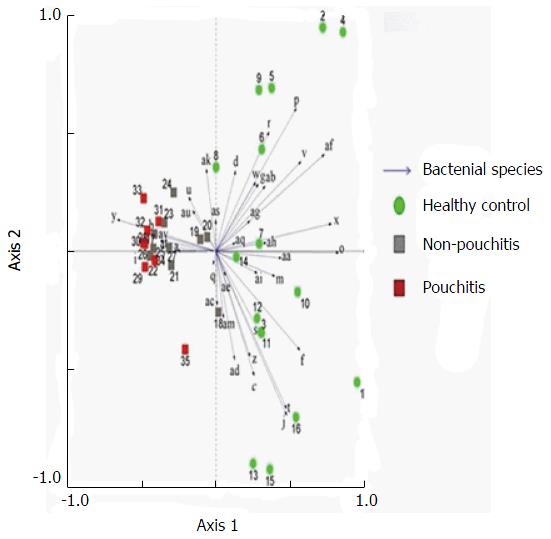
Figure 9 Principal component analysis of denaturing gradient gel electrophoresis microbial profiles in fecal samples of healthy controls and patients with pouch (with or without pouchitis).
Clustering of similar microbial profiles showed significant differences among the three groups.
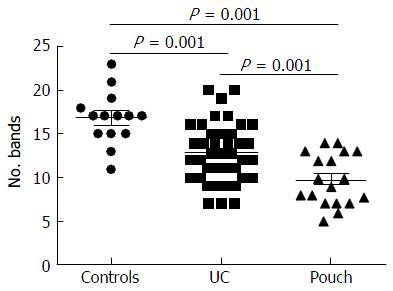
Figure 10 Number of bands in denaturing gradient gel electrophoresis profiles of samples obtained from all subjects.
The number of bands was reduced significantly in pouch group (UC patients who underwent IPAA, with or without pouchitis) compared with the control group and the UC group. UC: Ulcerative colitis.
- Citation: Li KY, Wang JL, Wei JP, Gao SY, Zhang YY, Wang LT, Liu G. Fecal microbiota in pouchitis and ulcerative colitis. World J Gastroenterol 2016; 22(40): 8929-8939
- URL: https://www.wjgnet.com/1007-9327/full/v22/i40/8929.htm
- DOI: https://dx.doi.org/10.3748/wjg.v22.i40.8929


