Copyright
©The Author(s) 2016.
World J Gastroenterol. Oct 14, 2016; 22(38): 8497-8508
Published online Oct 14, 2016. doi: 10.3748/wjg.v22.i38.8497
Published online Oct 14, 2016. doi: 10.3748/wjg.v22.i38.8497
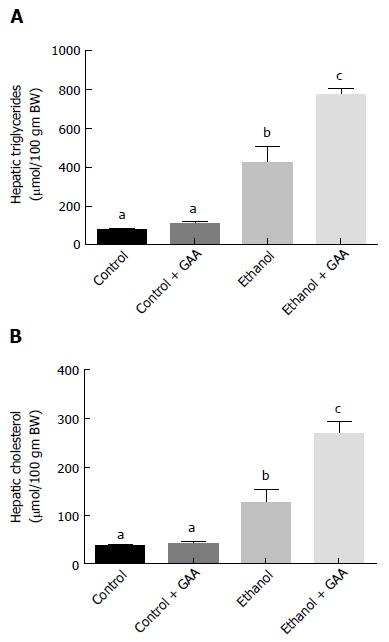
Figure 1 Effect of dietary ethanol or/and guanidinoacetate ingestion on hepatic triglycerides and cholesterol levels.
Male Wistar rats were fed the control or ethanol Lieber DeCarli diet with or without 0.36% GAA. After 6 wk of feeding, triglyceride (A) and cholesterol (B) content in the liver lipid extract was determined using the diagnostics kit (Thermo Electron Clinical Chemistry, Louisville, CO). The data shown are mean ± SEM of 5 determinations. Values not sharing a common subscript letter are statistically different, P < 0.05 vs control. GAA: Guanidinoacetate.
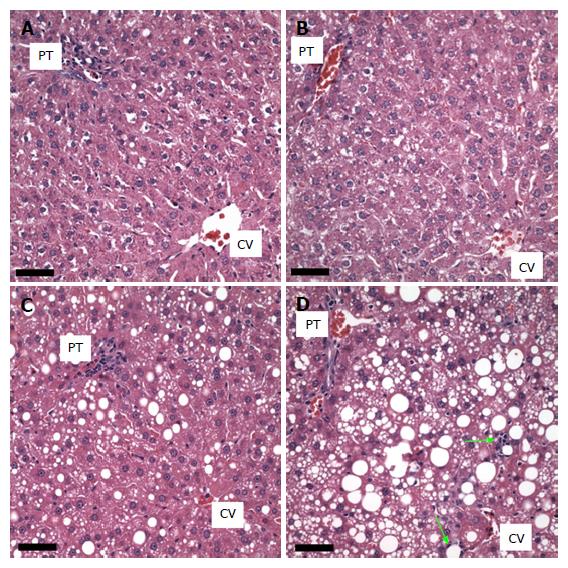
Figure 2 Effect of dietary ethanol or/and guanidinoacetate ingestion on liver histology.
Hematoxylin-eosin stained images of livers from animals fed the following diets are shown: Pair-fed control (A); 0.36% guanidinoacetate (GAA) (B); ethanol (C); ethanol + 0.36% GAA (D). Scale bars = 50 microns. Limited macrosteatosis was observed following the ethanol diet while much more extensive macrosteatosis with a limited number of cells exhibiting microsteatosis and a couple of small lipogranulomas (arrows) are seen in the livers of animals on the ethanol + 0.36% GAA diet. The livers of the animals on the 0.36% GAA diet are similar to the control livers. PT: Portal triad; CV: Central vein.
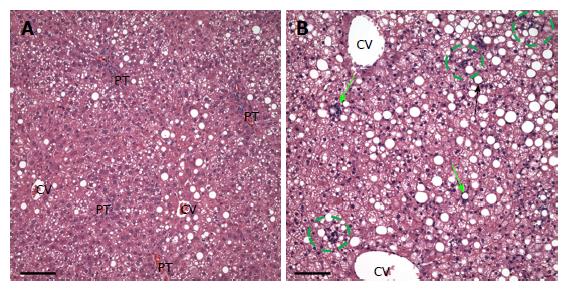
Figure 3 Hematoxylin-eosin staining of liver sections from rats fed ethanol (A) or ethanol + 0.
36% guanidinoacetate (B) for 6-wk. There is a diffuse inflammatory infiltrate in the liver from the rat fed ethanol plus guanidinoacetate. Green arrows indicate lipogranulomas, green circle indicates an inflammatory cell foci, Scale bar = 100 microns. PT: Portal triad, CV: Central vein.
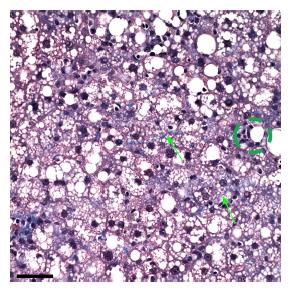
Figure 4 Higher magnified image from a Mallory trichrome stained liver section from a rat fed the ethanol + 0.
36% guanidinoacetate for 6 wk. Green arrows point to delicate trichrome collagen fiber and green circle surrounds small inflammatory cell foci. Note the presence of many macro- and micro-steatotic hepatocytes Scale bar = 50 microns.
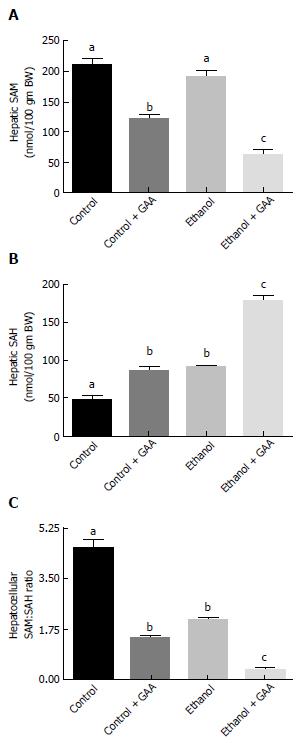
Figure 5 Effect of dietary ethanol and/or guanidinoacetate ingestion on hepatic S-adenosylmethionine, S-adenosylhomocysteine and S-adenosylmethionine: S-adenosylhomocysteine ratio.
Rats were fed the Lieber DeCarli control or ethanol diet with or without 0.36% GAA supplementation. After 6 wk of feeding, Hepatocellular SAM (A) and SAH (B) levels were determined by HPLC analysis as detailed in the “MATERIALS AND METHODS” section and (C) SAM:SAH ratio calculated. The data shown are mean ± SEM of 5 determinations. Values not sharing a common subscript letter are statistically different, P < 0.05 vs control. GAA: Guanidinoacetate; SAM: S-adenosylmethionine; SAH: S-adenosylhomocysteine.
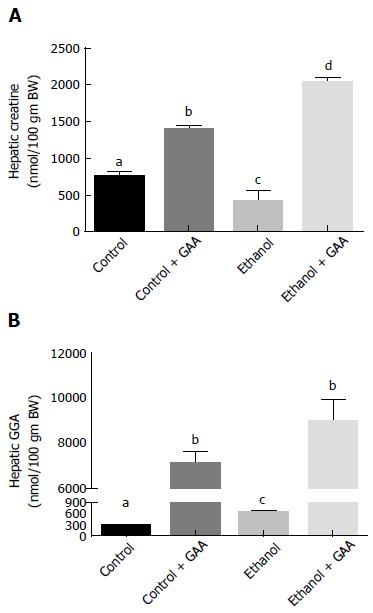
Figure 6 Effect of dietary ethanol and/or guanidinoacetate ingestion on hepatic creatine and guanidinoacetate levels.
Rats were fed the Lieber DeCarli control or ethanol diet with or without 0.36% GAA supplementation. After 6 wk of feeding, liver Creatine (A) and GAA (B) levels were determined by HPLC analysis as detailed in the “MATERIALS AND METHODS” section. The data shown are mean ± SEM of 5 determinations. Values not sharing a common subscript letter are statistically different, P < 0.05 vs control. GAA: Guanidinoacetate.
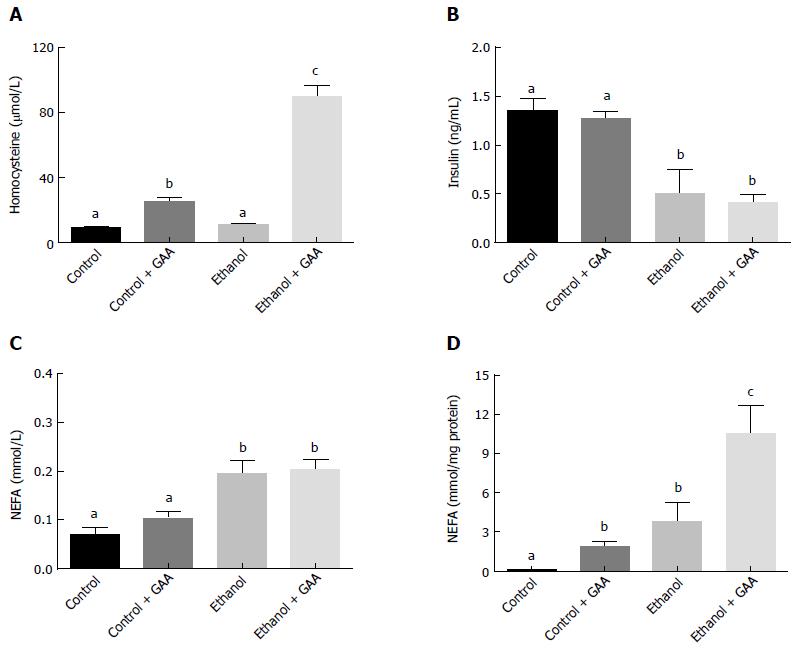
Figure 7 Effect of dietary ethanol and/or guanidinoacetate ingestion on serum homocysteine, insulin, non-essential fatty acid and hepatic non-essential fatty acid levels.
Rats were fed the Lieber DeCarli control or ethanol diet with or without 0.36% GAA supplementation. After 6 wk of feeding, serum homocysteine (A) insulin (B) NEFA (C) and hepatic NEFA (Dlevels were determined by HPLC or biochemical analysis as detailed in the Materials and Methods section. The data shown are means ± SEM of 5 determinations. Values not sharing a common subscript letter are statistically different, P < 0.05 vs control. GAA: Guanidinoacetate; NEFA: Non-essential fatty acid.
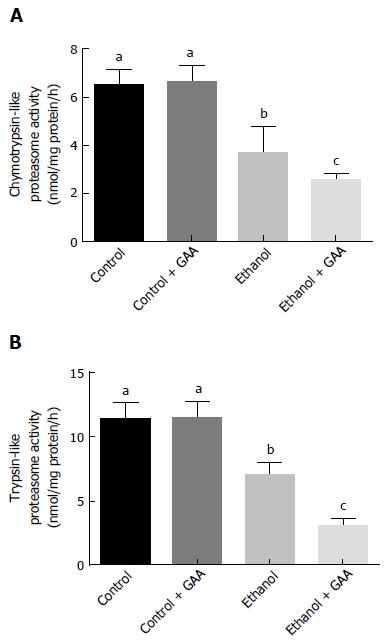
Figure 8 Effect of dietary ethanol and/or guanidinoacetate on peptidase specific activities of the proteasome.
Rats were fed the Lieber DeCarli control or ethanol diet with or without 0.36% GAA supplementation. After 6 wk of feeding, liver cytosols were prepared and assayed for the chymotrypsin- (A) and trypsin-like (B) specific activities of the proteasome as detailed in the “MATERIALS AND METHODS” section. The results are mean ± SEM of 8-10 determinations from each group and activities are expressed as nmol AFC generated/mg protein/h. Values not sharing a common subscript letter are statistically different, P < 0.05 vs control. GAA: Guanidinoacetate.
- Citation: Osna NA, Feng D, Ganesan M, Maillacheruvu PF, Orlicky DJ, French SW, Tuma DJ, Kharbanda KK. Prolonged feeding with guanidinoacetate, a methyl group consumer, exacerbates ethanol-induced liver injury. World J Gastroenterol 2016; 22(38): 8497-8508
- URL: https://www.wjgnet.com/1007-9327/full/v22/i38/8497.htm
- DOI: https://dx.doi.org/10.3748/wjg.v22.i38.8497


