Copyright
©The Author(s) 2016.
World J Gastroenterol. Oct 14, 2016; 22(38): 8497-8508
Published online Oct 14, 2016. doi: 10.3748/wjg.v22.i38.8497
Published online Oct 14, 2016. doi: 10.3748/wjg.v22.i38.8497
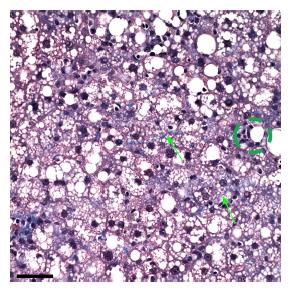
Figure 4 Higher magnified image from a Mallory trichrome stained liver section from a rat fed the ethanol + 0.
36% guanidinoacetate for 6 wk. Green arrows point to delicate trichrome collagen fiber and green circle surrounds small inflammatory cell foci. Note the presence of many macro- and micro-steatotic hepatocytes Scale bar = 50 microns.
- Citation: Osna NA, Feng D, Ganesan M, Maillacheruvu PF, Orlicky DJ, French SW, Tuma DJ, Kharbanda KK. Prolonged feeding with guanidinoacetate, a methyl group consumer, exacerbates ethanol-induced liver injury. World J Gastroenterol 2016; 22(38): 8497-8508
- URL: https://www.wjgnet.com/1007-9327/full/v22/i38/8497.htm
- DOI: https://dx.doi.org/10.3748/wjg.v22.i38.8497


