Copyright
©The Author(s) 2016.
World J Gastroenterol. Aug 7, 2016; 22(29): 6706-6715
Published online Aug 7, 2016. doi: 10.3748/wjg.v22.i29.6706
Published online Aug 7, 2016. doi: 10.3748/wjg.v22.i29.6706
Figure 1 Body weight and calorie content in the food intake (calorie intake).
Shown are body weight (A) and calorie intake (B) of rats at baseline, 4, 8 and 12 wk after surgery. aP < 0.05 vs control group.
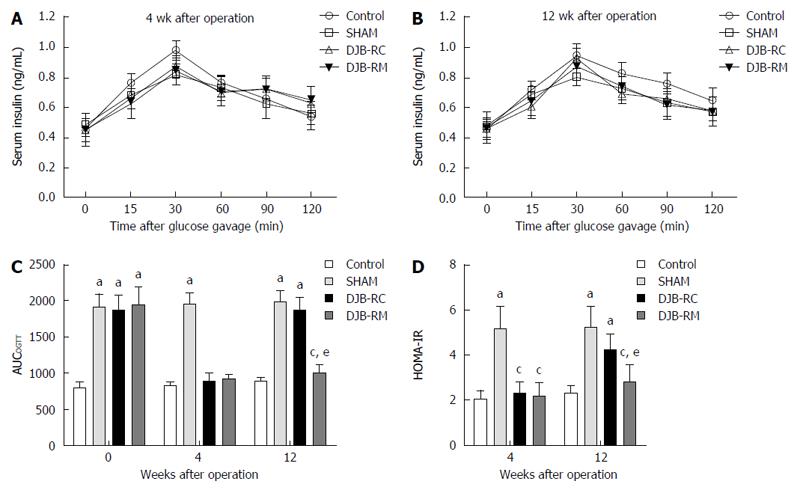
Figure 2 Serum insulin after oral glucose administration.
Shown are levels of serum insulin after oral glucose gavage (1 g/kg) at 4 wk (A) and 12 wk (B) after surgery, between which there are no significant differences with the use of mixed model one-way analysis of variance followed by Bonferroni post hoc comparisons. Area under the curves for oral glucose tolerance test and homeostasis model assessment of insulin resistance are demonstrated in C and D respectively. aP < 0.05 vs control group; cP < 0.05 vs sham group; eP < 0.05 vs DJB-RC group. DJB-RC: Duodenal-jejunal bypass recurrence group; DJB-RM: Duodenal-jejunal bypass-remission group.
Figure 3 Level of glucagon-like peptide 1 after administration of oral glucose.
Shown are glucagon-like peptide 1 (GLP-1) level after oral glucose gavage (1 g/kg) at 4 wk (panel A) and 12 wk (panel B) after surgery. In terms of global GLP-1 concentration, the illustrations in the rectangles show that there are significant differences between the groups with the use of mixed model one-way analysis of variance followed by Bonferroni post hoc comparisons. DJB-RC: Duodenal-jejunal bypass recurrence group; DJB-RM: Duodenal-jejunal bypass-remission group.
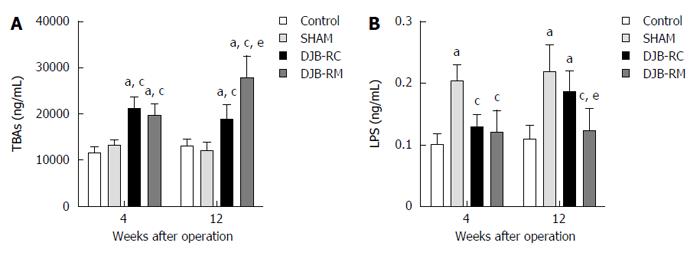
Figure 4 Fasting serum total bile acids and lipopolysaccharide.
Fasting serum TBAs (A) and LPS (B) were measured at 4 and 12 wk after surgery. aP < 0.05 vs control group; cP < 0.05 vs sham group; eP < 0.05 vs DJB-RC group. DJB-RC: Duodenal-jejunal bypass recurrence group; DJB-RM: Duodenal-jejunal bypass-remission group; TBAs: total bile acids; LPS: Lipopolysaccharide.
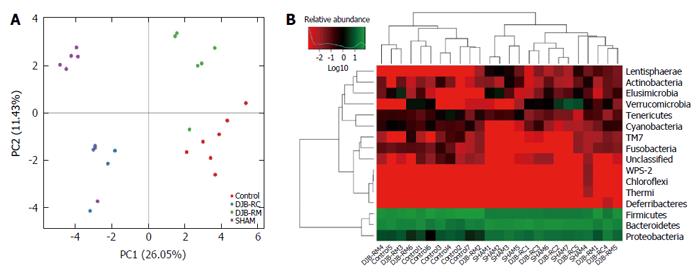
Figure 5 Principal component analysis and heatmap analysis.
A: Principal component analysis was used to construct a 2-D graph to summarize the factors mainly responsible for this difference. Similarity was high when two samples were closely located. A number in brackets represents contributions of principal components to differences among samples; B: Heat map analysis: The longitudinal clustering indicates the similarity of all species among different samples, and horizontal clustering indicates the similarity of certain species among different samples, the closer the distance and the shorter the branch length, the more similar the species composition is between the samples.
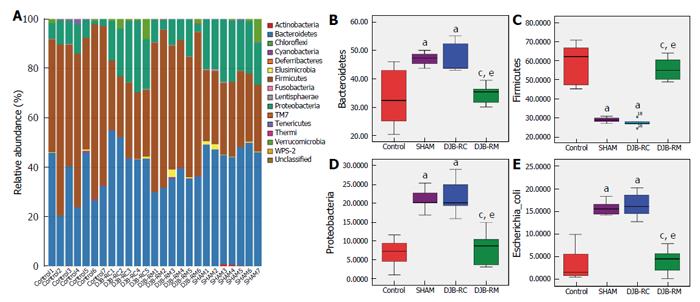
Figure 6 Species annotation.
Species annotation (A) is the taxonomic composition distribution histogram of each sample at the phylum level. The ratios of each phylum in certain samples are displayed. The relative abundance of Bacteroidetes (B), Firmicutes (C), Proteobacteria (D) and Escherichia coli (E) between the groups was analyzed by the Wilcoxon test. aP < 0.05 vs control group; cP < 0.05 vs sham group; eP < 0.05 vs DJB-RC group. DJB-RC: Duodenal-jejunal bypass recurrence group; DJB-RM: Duodenal-jejunal bypass-remission group.
- Citation: Zhong MW, Liu SZ, Zhang GY, Zhang X, Liu T, Hu SY. Alterations in gut microbiota during remission and recurrence of diabetes after duodenal-jejunal bypass in rats. World J Gastroenterol 2016; 22(29): 6706-6715
- URL: https://www.wjgnet.com/1007-9327/full/v22/i29/6706.htm
- DOI: https://dx.doi.org/10.3748/wjg.v22.i29.6706


