Copyright
©The Author(s) 2016.
World J Gastroenterol. May 21, 2016; 22(19): 4716-4731
Published online May 21, 2016. doi: 10.3748/wjg.v22.i19.4716
Published online May 21, 2016. doi: 10.3748/wjg.v22.i19.4716
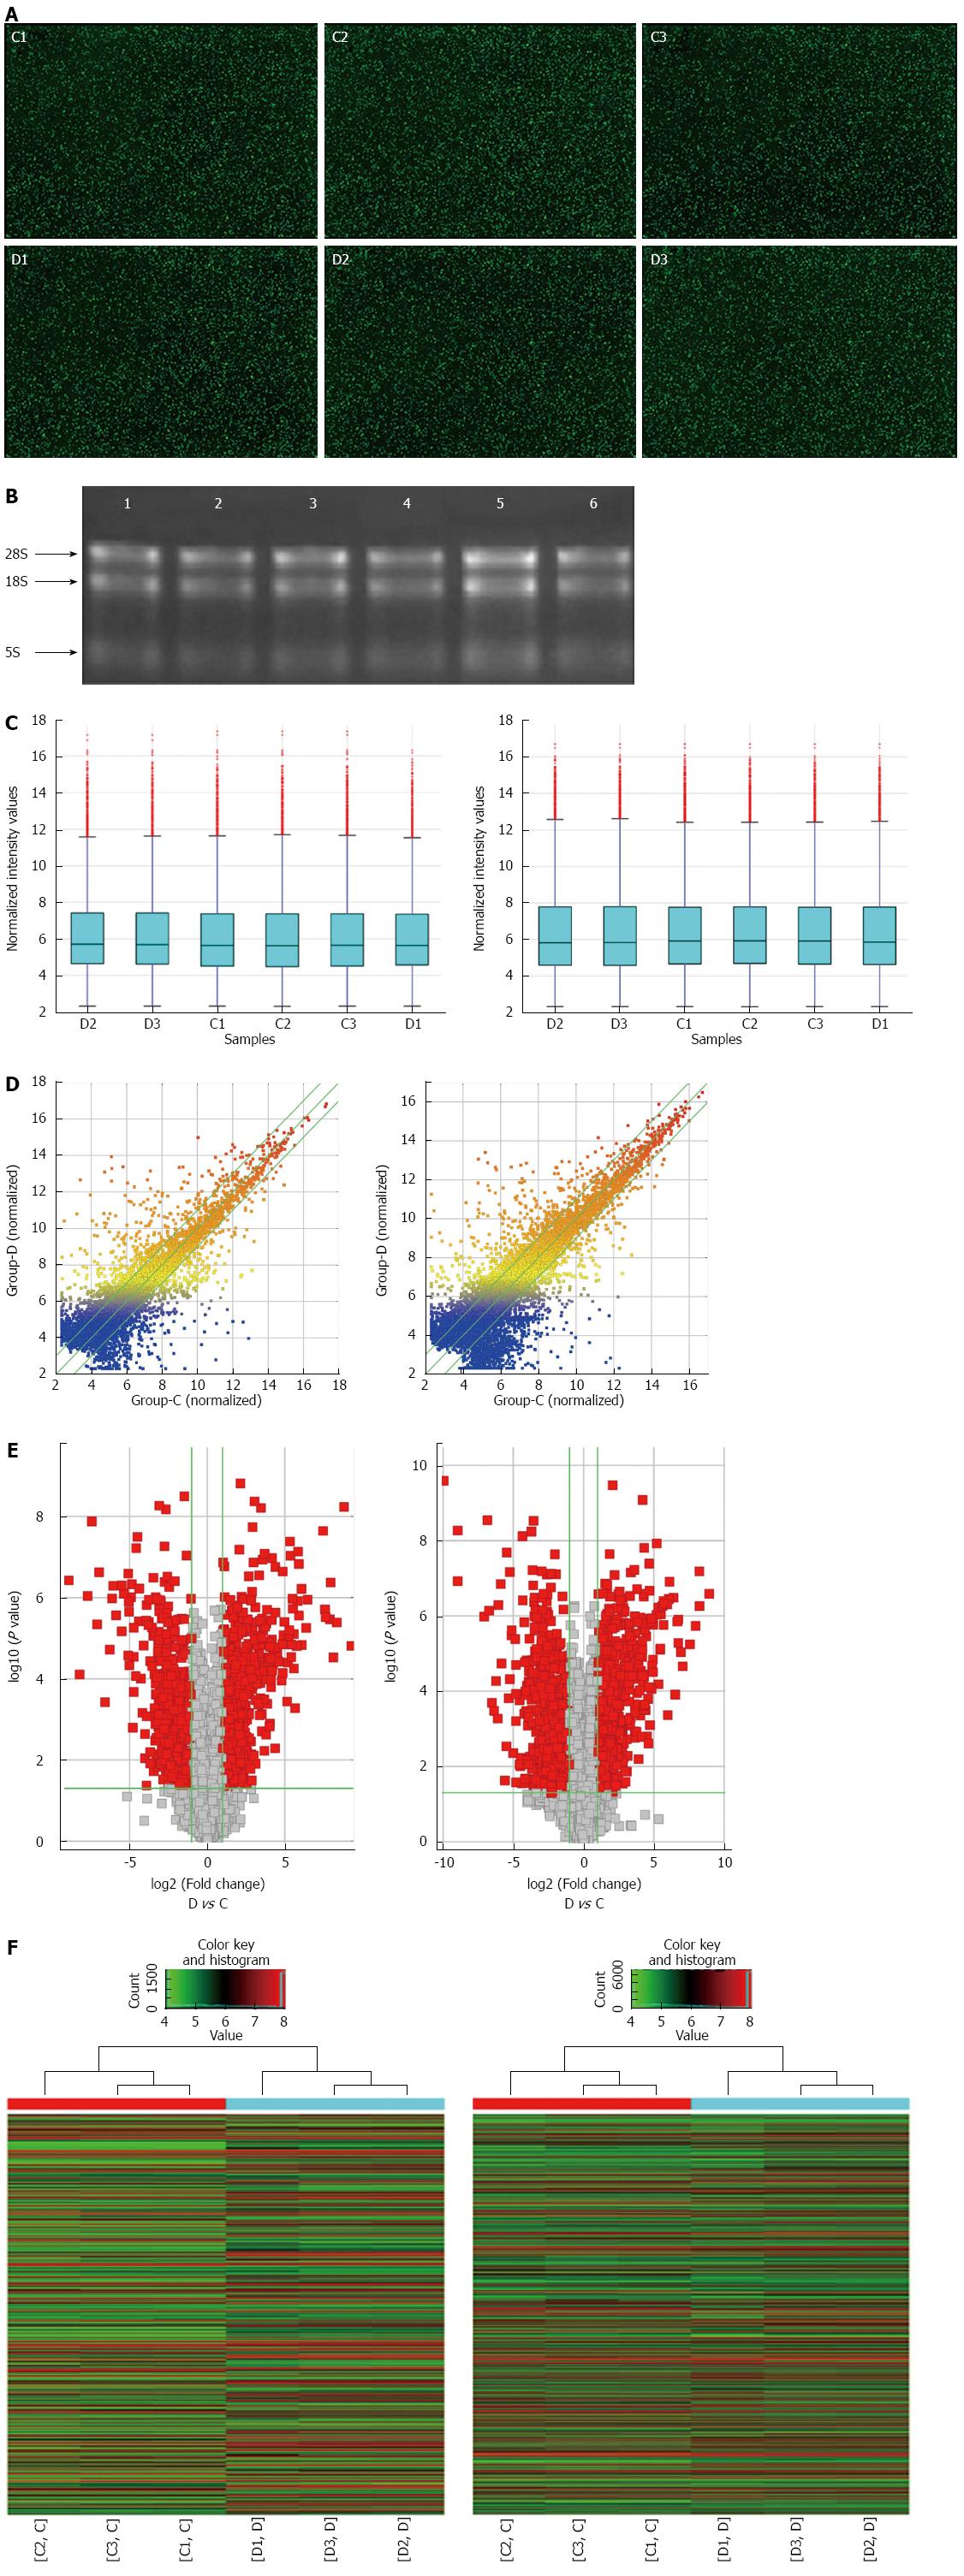
Figure 1 Raw image, RNA quality and bioinformatics analysis of differentially expressed long noncoding RNAs and mRNAs in Chrohn’s disease patients.
A: Raw image of the microarray analysis. The green dot on the black background represents a single lncRNA or mRNA. C1-C3 were control samples, and D1-D3 were CD samples; B: RNA elecotrophoretogram showing good RNA quality (1-3 were control, and 4-6 were CD); C: Box plot visualizing the lncRNA (left panel) and mRNA (right panel) expression variations; D, E: Scatter plot and volcano plot showing the distributions of lncRNAs (left panel) and mRNAs (right panel) in a more direct way. After normalization, the distributions of the log2 ratios among samples were nearly the same. The values of the X- and Y-axes in the scatter plot were the averaged normalized signal values of the group (log2 scaled). The green lines in the scatter plot and volcano plot represent the default significant fold change (2.0); F: Hierarchical cluster analysis of microarray data assessing the significant expression of lncRNAs (left panel) and mRNAs (right panel) between the CD and control groups. Red and green denote high and low expression, respectively. Each RNA is represented by a single row of colored boxes, and each sample is represented by a single column.
Figure 2 Gene ontology analysis of up-regulated mRNAs.
A: The GO analysis includes classification of biological process (BP), cellular component (CC) and molecular function (MF); B: The summaries of significant GO terms (BP, CC and MF) of differentially expressed genes are shown in the up and down panels according to the values in the enrichment score and the fold enrichment.
Figure 3 Gene ontology analysis of down-regulated mRNAs.
A: The GO analysis includes classification of biological process (BP), cellular component (CC) and molecular function (MF); B: The summaries of significant GO terms (BP, CC and MF) of differentially expressed genes are shown in the up and down panels according to the values in the enrichment score and the fold enrichment.
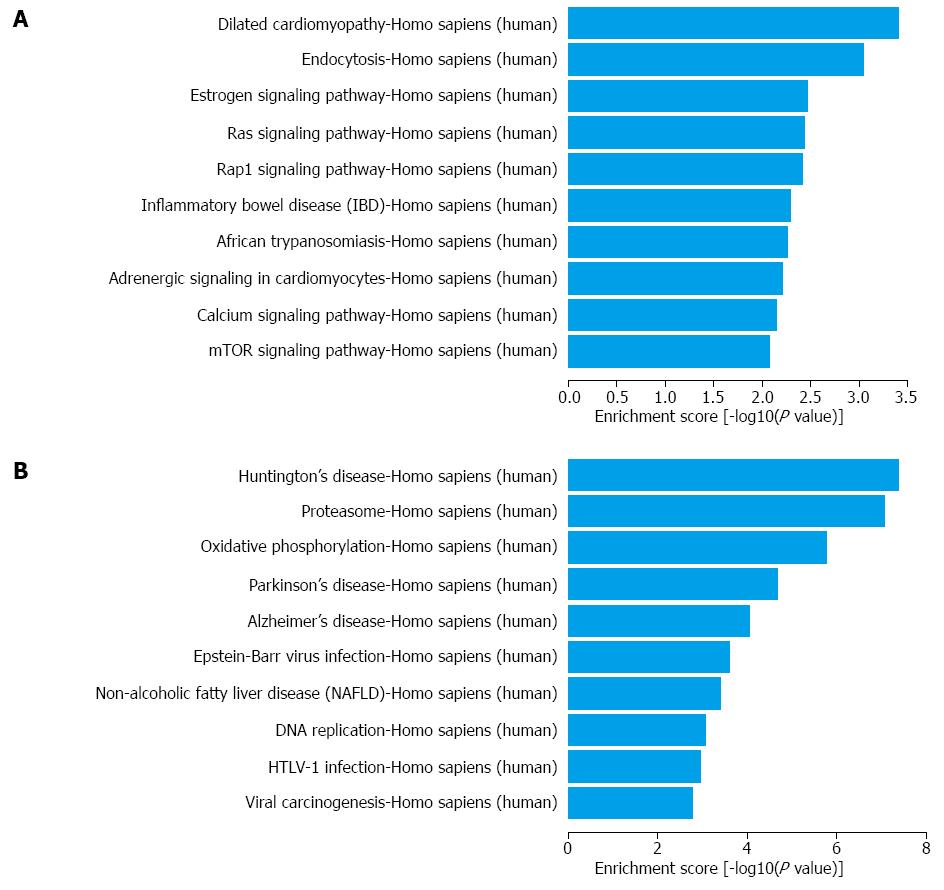
Figure 4 Top 10 KEGG pathways in up- (A) and down-regulated (B) mRNAs.
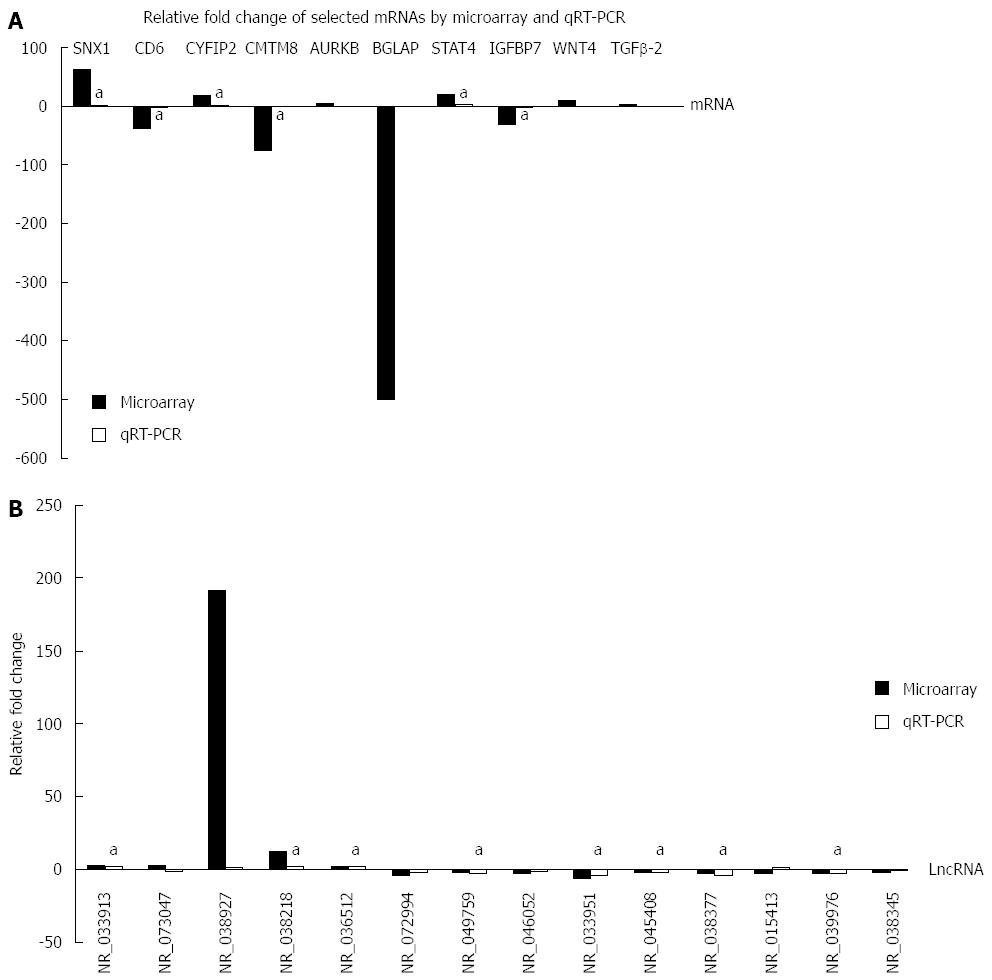
Figure 5 Relative fold changes of lncRNAs and mRNAs by microarray and qRT-PCR.
The column upwards indicates up-regulation, and downwards indicates down-regulation. aP < 0.05, microarray vs qRT-PCR. A: mRNA data; B: LncRNA data.
- Citation: Chen D, Liu J, Zhao HY, Chen YP, Xiang Z, Jin X. Plasma long noncoding RNA expression profile identified by microarray in patients with Crohn’s disease. World J Gastroenterol 2016; 22(19): 4716-4731
- URL: https://www.wjgnet.com/1007-9327/full/v22/i19/4716.htm
- DOI: https://dx.doi.org/10.3748/wjg.v22.i19.4716


