Copyright
©The Author(s) 2016.
World J Gastroenterol. May 21, 2016; 22(19): 4716-4731
Published online May 21, 2016. doi: 10.3748/wjg.v22.i19.4716
Published online May 21, 2016. doi: 10.3748/wjg.v22.i19.4716
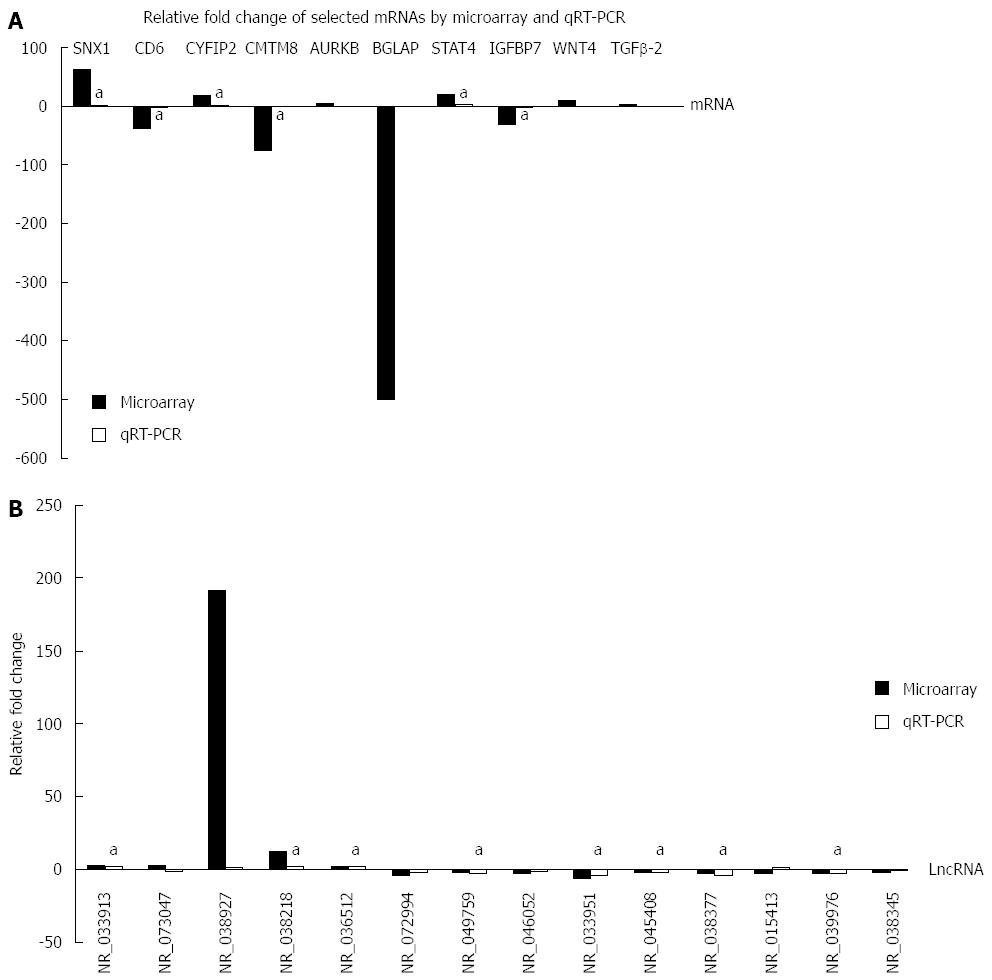
Figure 5 Relative fold changes of lncRNAs and mRNAs by microarray and qRT-PCR.
The column upwards indicates up-regulation, and downwards indicates down-regulation. aP < 0.05, microarray vs qRT-PCR. A: mRNA data; B: LncRNA data.
- Citation: Chen D, Liu J, Zhao HY, Chen YP, Xiang Z, Jin X. Plasma long noncoding RNA expression profile identified by microarray in patients with Crohn’s disease. World J Gastroenterol 2016; 22(19): 4716-4731
- URL: https://www.wjgnet.com/1007-9327/full/v22/i19/4716.htm
- DOI: https://dx.doi.org/10.3748/wjg.v22.i19.4716


