Copyright
©The Author(s) 2016.
World J Gastroenterol. May 7, 2016; 22(17): 4354-4361
Published online May 7, 2016. doi: 10.3748/wjg.v22.i17.4354
Published online May 7, 2016. doi: 10.3748/wjg.v22.i17.4354
Figure 1 Increased cytokine expression and decreased miR-125b expression in hepatitis C virus core protein treated THP-1 cells.
THP-1 cells were treated with HCV core recombinant protein at a final concentration of 0.5, 1.0 or 5.0 μg/mL and incubated for 6, 12 or 24 h. The levels of tumor necrosis factor (TNF)-α, interleukin (IL)-10, and IL-6 in culture supernatants were analyzed by enzyme-linked immunosorbent assay. The cellular miR-125b levels were determined by real-time quantitative polymerase chain reaction. The data are representative of three experiments and shown as mean ± SEM.
Figure 2 TLR2-MyD88 pathway dependent HCV core protein-induced miR-125b repression.
TLR2 (A) or MyD88 (B) mRNA was analyzed by real-time quantitative polymerase chain reaction (RT-qPCR) and protein lysates were analyzed by Western blot at 6 h post transfection. The transfected cells were infected with HCV core protein at 5 μg/mL for 6 h and miR-125b expression was detected by RT-qPCR analysis (C). Cell data are representative of three experiments and are shown as mean ± SEM (P < 0.001 by unpaired two-tailed Student’s t-test).
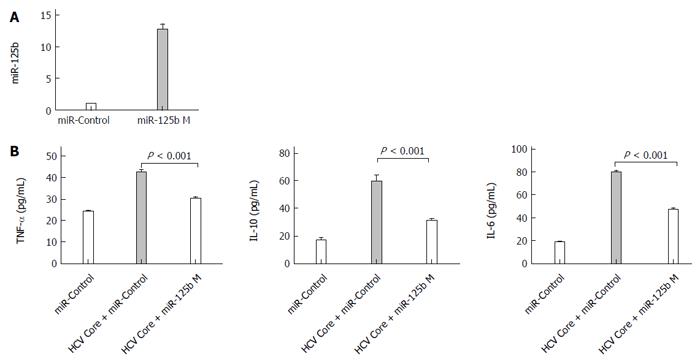
Figure 3 The miR-125b mimic abrogats hepatitis C virus core protein-induced upregulation of cytokines.
A: Real-time quantitative polymerase chain reaction analysis of miR-125b levels in THP-1 cells transfected with 0.4 nmol/L miRNA negative control (miR-control) or miR-125b mimic (miR-125b M), respectively; B: Twenty four hours after transfection, cells were treated with 5.0 μg/mL HCV core protein for an additional 6 h. The concentrations of tumor necrosis factor (TNF)-α, interleukin (IL)-10 and IL-6 in culture supernatants were analyzed by enzyme-linked immunosorbent assay. These data are representative of three experiments and shown as mean ± SEM (P < 0.001 by unpaired two-tailed Student’s t-test).
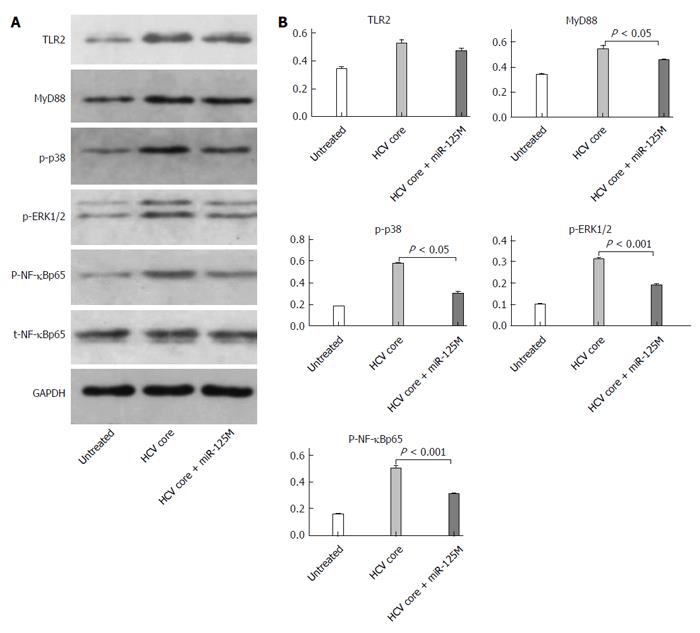
Figure 4 MiR-125b suppresses phosphorylation of NF-κBp65, ERK1/2 and p38.
A: THP-1 cells were transfected with control or miR-125b mimic (miR-125bM) for 24 h, followed by incubation with hepatitis C virus (HCV) core protein at 5.0 μg/mL for 6 h. Western blot analysis of Toll-like receptor 2 (TLR2), MyD88, NF-κB, phosphorylated NF-κB, phosphorylated ERK1/2 and phosphorylated P38 in the collected cells; B: Densitometric quantification of the western blot data was performed using Quantity One Software. These data are representative of three experiments and shown as mean ± SEM (P < 0.05, P < 0.001 by unpaired two-tailed Student’s t-test).
- Citation: Peng C, Wang H, Zhang WJ, Jie SH, Tong QX, Lu MJ, Yang DL. Inhibitory effect of miR-125b on hepatitis C virus core protein-induced TLR2/MyD88 signaling in THP-1 cells. World J Gastroenterol 2016; 22(17): 4354-4361
- URL: https://www.wjgnet.com/1007-9327/full/v22/i17/4354.htm
- DOI: https://dx.doi.org/10.3748/wjg.v22.i17.4354


