Copyright
©The Author(s) 2016.
World J Gastroenterol. Apr 21, 2016; 22(15): 3952-3961
Published online Apr 21, 2016. doi: 10.3748/wjg.v22.i15.3952
Published online Apr 21, 2016. doi: 10.3748/wjg.v22.i15.3952
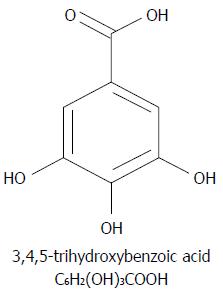
Figure 1 Chemical structure of gallic acid.
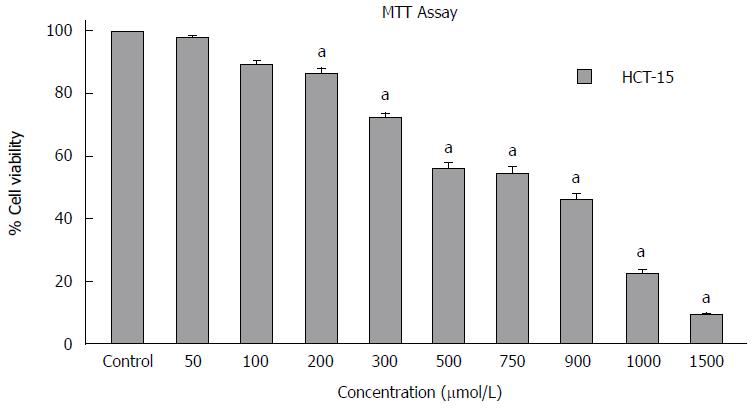
Figure 2 Cell proliferation inhibition by gallic acid of colon cancer cells.
Human colorectal carcinoma HCT-15 cells grown in 96-well plate were treated with various concentration of gallic acid (GA) (0-1500 μmol/L) for 72 h. Percentage of mean cell viability along-with the SD is indicated (n = 3). Mean differences are significant compared with untreated control cells (P < 0.05 vs untreated control cells). Statistical analysis showed that GA treatment results in significant inhibition (aP < 0.05) compared with untreated control cells starting at 200 μmol/L for HCT-15 cells. Data represents mean ± SD.
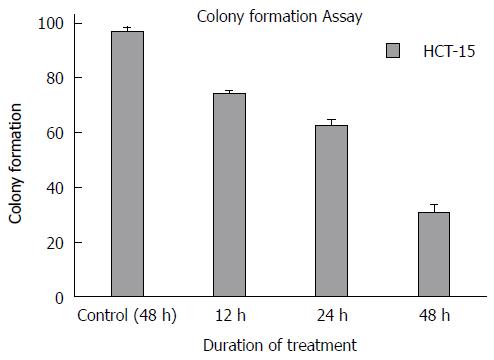
Figure 3 Colony inhibitory activity of gallic acid against colon cancer cells.
After various incubation periods of gallic acid (GA) treatment, colonies formed were stained with 0.5% crystal violet and counted, and percentage of survival was calculated by normalizing the values. Data reported is the mean ± SD from three different observations. Mean differences are significant at 12 h, 24 h and 48 h compared with untreated control cells (P < 0.05 vs untreated control cells).
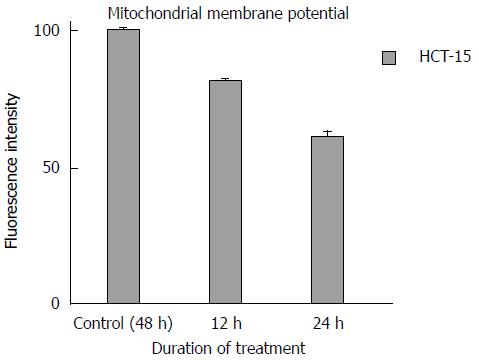
Figure 4 Effects of gallic acid on MMP (ΔΨm) in HCT-15 cells.
Human colorectal carcinoma (HCT-15) cells were treated with GA for specified time-periods and then mitochondrial membrane potential were determined using rhodamine-123 by flow cytometry. Mean differences are significant at 12 h and 24 h compared with untreated control cells (P < 0.05 vs untreated control cells).
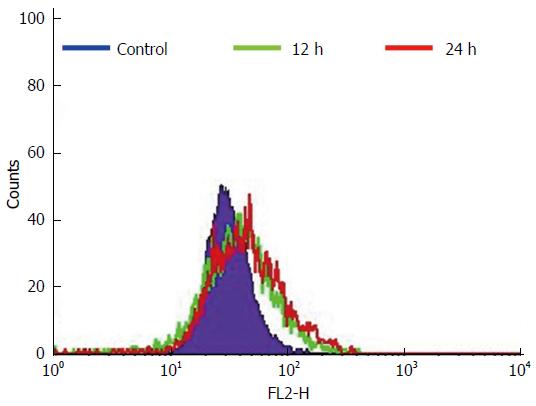
Figure 5 Lipid layer break provoked by gallic acid.
HCT-15 cells were treated with gallic acid (GA) and evaluated using merocyanine-540 to quantify the lipid layer breaks (LLBs). The fluorescence intensity was estimated using flow cytometry. Data is representative of three independent experiments, mean differences are significant at 12 h and 24 h compared with untreated control cells (P < 0.05 vs untreated control cells).
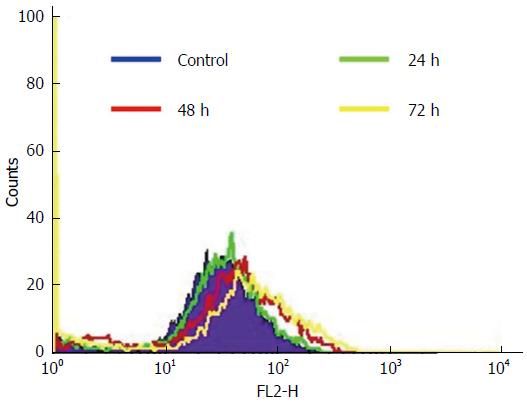
Figure 6 Gallic acid induced reactive oxygen species generation.
HCT-15 cells were cultured in the presence or absence of gallic acid (GA) for the specified time points. DCFH-DA fluorescence intensity was detected by using flow cytometry. Data represented is the maximum of three independent experiments. Mean differences are significant at 24 h, 48 h and 72 h compared with untreated control cells (P < 0.05 vs untreated control cells).
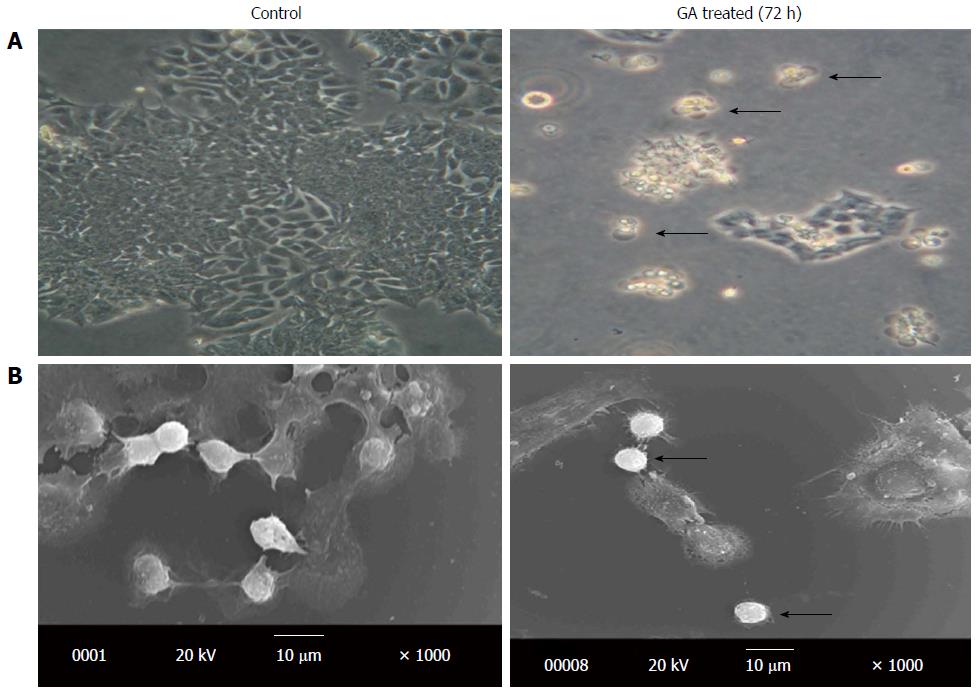
Figure 7 Representative photomicrograph and scanning electron microscopic images of three independent experiments.
A: Photomicrograph images of untreated and gallic acid (GA) treated HCT-15 cells. The arrow mark indicates cell death after GA treatment; B: Scanning electron microscopic images of untreated and GA treated HCT-15 cells. The arrow mark represents the rounding up of HCT-15 cells after GA treatment.
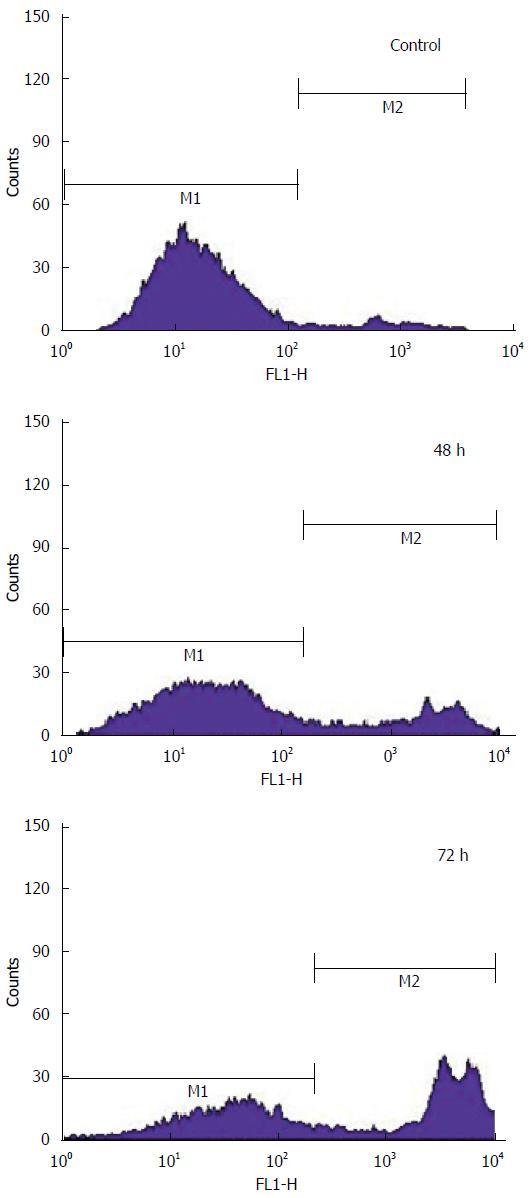
Figure 8 Apoptosis assessment using Yo-Pro-1 dye by flow cytometry.
HCT-15 cells was treated with gallic acid (GA) for specified time points. The distribution of the cell population changed according to the exposure time as indicated by M1 and M2. Data represented is the maximum of three independent experiments and the differences in the values of M2 were significant at 48 h and 72 h compared to untreated control cells (P < 0.05 vs untreated control cells).
- Citation: Subramanian AP, Jaganathan SK, Mandal M, Supriyanto E, Muhamad II. Gallic acid induced apoptotic events in HCT-15 colon cancer cells. World J Gastroenterol 2016; 22(15): 3952-3961
- URL: https://www.wjgnet.com/1007-9327/full/v22/i15/3952.htm
- DOI: https://dx.doi.org/10.3748/wjg.v22.i15.3952


