Copyright
©The Author(s) 2016.
World J Gastroenterol. Apr 21, 2016; 22(15): 3952-3961
Published online Apr 21, 2016. doi: 10.3748/wjg.v22.i15.3952
Published online Apr 21, 2016. doi: 10.3748/wjg.v22.i15.3952
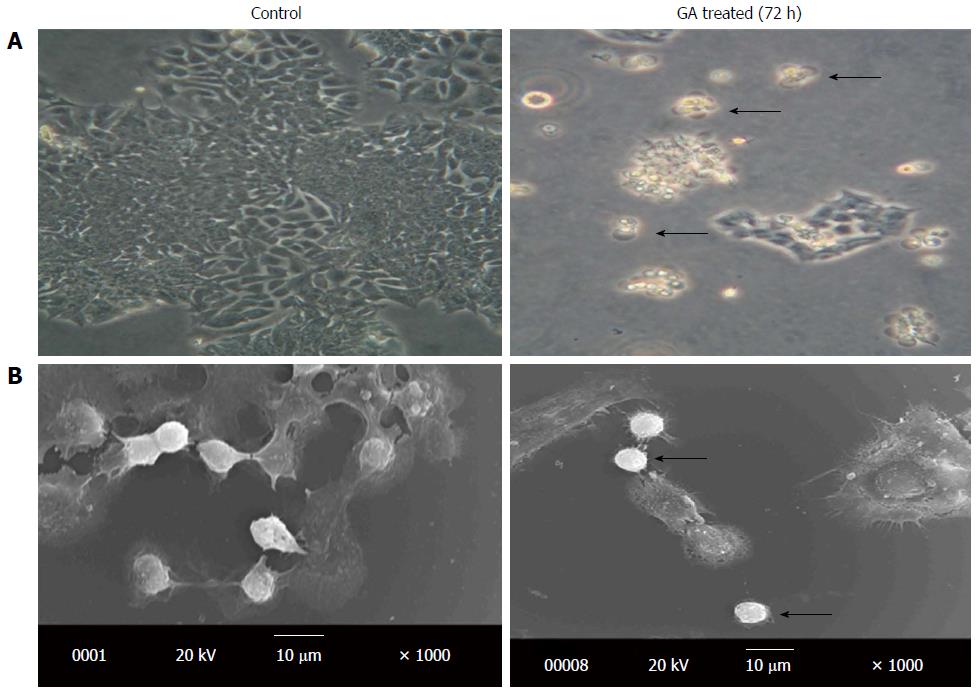
Figure 7 Representative photomicrograph and scanning electron microscopic images of three independent experiments.
A: Photomicrograph images of untreated and gallic acid (GA) treated HCT-15 cells. The arrow mark indicates cell death after GA treatment; B: Scanning electron microscopic images of untreated and GA treated HCT-15 cells. The arrow mark represents the rounding up of HCT-15 cells after GA treatment.
- Citation: Subramanian AP, Jaganathan SK, Mandal M, Supriyanto E, Muhamad II. Gallic acid induced apoptotic events in HCT-15 colon cancer cells. World J Gastroenterol 2016; 22(15): 3952-3961
- URL: https://www.wjgnet.com/1007-9327/full/v22/i15/3952.htm
- DOI: https://dx.doi.org/10.3748/wjg.v22.i15.3952


