Copyright
©The Author(s) 2016.
World J Gastroenterol. Apr 21, 2016; 22(15): 3952-3961
Published online Apr 21, 2016. doi: 10.3748/wjg.v22.i15.3952
Published online Apr 21, 2016. doi: 10.3748/wjg.v22.i15.3952
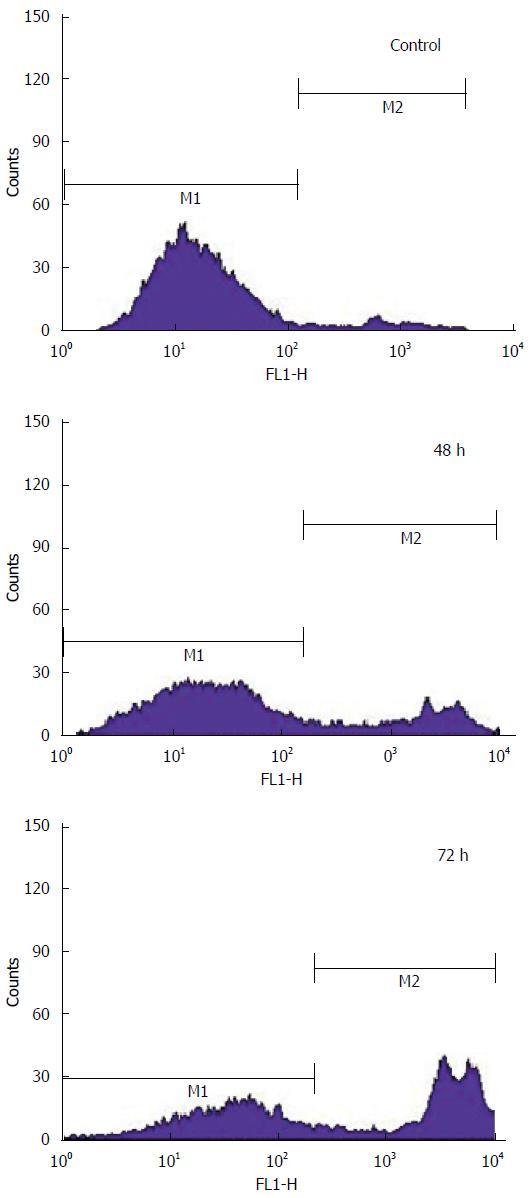
Figure 8 Apoptosis assessment using Yo-Pro-1 dye by flow cytometry.
HCT-15 cells was treated with gallic acid (GA) for specified time points. The distribution of the cell population changed according to the exposure time as indicated by M1 and M2. Data represented is the maximum of three independent experiments and the differences in the values of M2 were significant at 48 h and 72 h compared to untreated control cells (P < 0.05 vs untreated control cells).
- Citation: Subramanian AP, Jaganathan SK, Mandal M, Supriyanto E, Muhamad II. Gallic acid induced apoptotic events in HCT-15 colon cancer cells. World J Gastroenterol 2016; 22(15): 3952-3961
- URL: https://www.wjgnet.com/1007-9327/full/v22/i15/3952.htm
- DOI: https://dx.doi.org/10.3748/wjg.v22.i15.3952


