Copyright
©The Author(s) 2015.
World J Gastroenterol. Feb 21, 2015; 21(7): 2199-2205
Published online Feb 21, 2015. doi: 10.3748/wjg.v21.i7.2199
Published online Feb 21, 2015. doi: 10.3748/wjg.v21.i7.2199
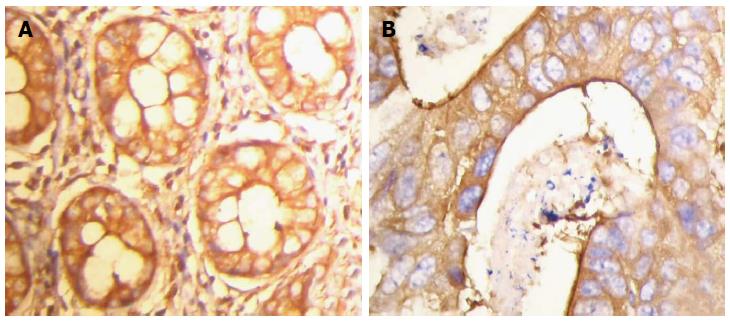
Figure 1 Expression of filamin A in normal colorectal tissues and colorectal adenocarcinoma tissues detected by immunohistochemistry (SP method, × 400).
A: High expression of filamin A (FLNa) in normal tissues; B: Low expression of FLNa in adenocarcinoma tissues.
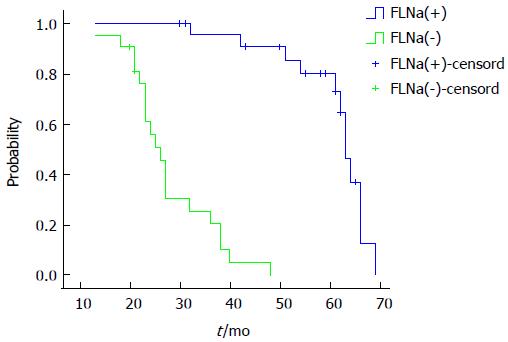
Figure 2 Expression of filamin A and its correlation with survival time.
Figure 3 Expression of filamin A in colorectal adenocarcinoma tissues and normal colorectal tissues detected by reverse transcription polymerase chain reaction.
Lane 1: Colorectal adenocarcinoma tissues; Lane 2: Normal colorectal tissues. FLNa: Filamin A.
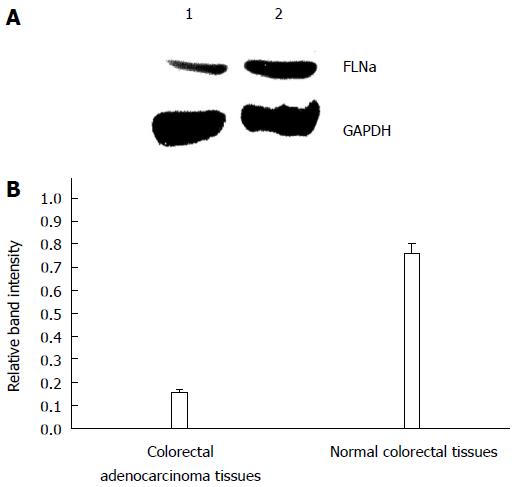
Figure 4 Expression of filamin A in colorectal adenocarcinoma tissues and normal colorectal tissues detected by Western blot.
Lane 1: Colorectal adenocarcinoma tissues; Lane 2: Normal colorectal tissues.
- Citation: Tian ZQ, Shi JW, Wang XR, Li Z, Wang GY. New cancer suppressor gene for colorectal adenocarcinoma: Filamin A. World J Gastroenterol 2015; 21(7): 2199-2205
- URL: https://www.wjgnet.com/1007-9327/full/v21/i7/2199.htm
- DOI: https://dx.doi.org/10.3748/wjg.v21.i7.2199


