Copyright
©The Author(s) 2015.
World J Gastroenterol. Feb 7, 2015; 21(5): 1488-1497
Published online Feb 7, 2015. doi: 10.3748/wjg.v21.i5.1488
Published online Feb 7, 2015. doi: 10.3748/wjg.v21.i5.1488
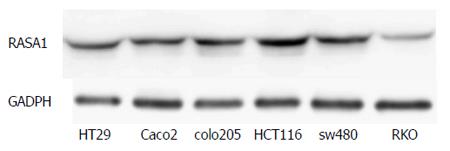
Figure 1 RAS p21 GTPase activating protein 1 expression in different colon cancer cell lines was detected by Western blot.
RAS p21 GTPase activating protein 1 (RASA1) expression in RKO cells was the lowest among the cell lines studied.
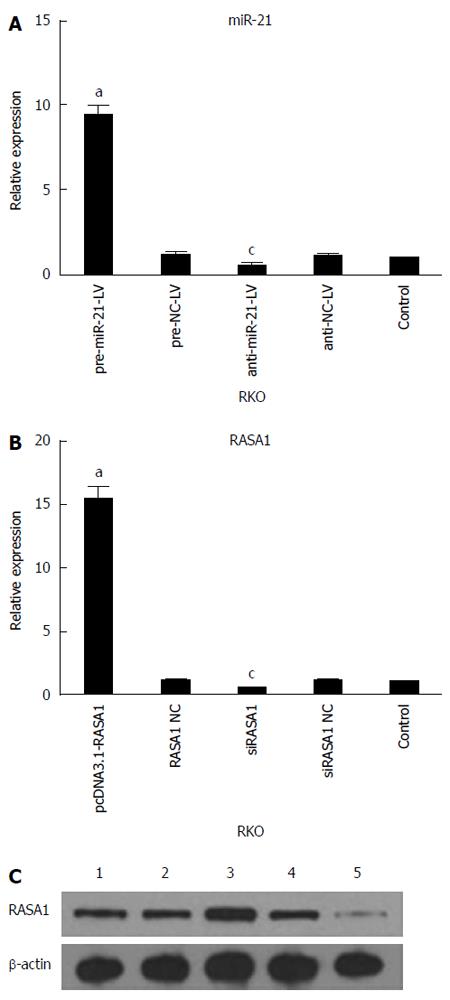
Figure 2 Validation of transfection efficiency.
A: The expression of miR-21 in cells with up/down-regulated miR-21 was assessed by quantitative reverse transcription-polymerase chain reaction (qRT-PCR) (n = 4, aP < 0.05 vs control; cP < 0.05 vs control); B: qRT-PCR was used to quantify the expression of RASA1 mRNA (n = 3,aP < 0.05 vs control; cP < 0.05 vs control); C: Western blot detection of RASA1 protein levels; 1: Control; 2: pcDNA3.1-RASA1 NC; 3: pcDNA3.1-RASA1; 4: siRASA1 NC; 5: siRASA1. RASA1: RAS p21 GTPase activating protein 1; NC: Non-coding; LV: Lentivirus.
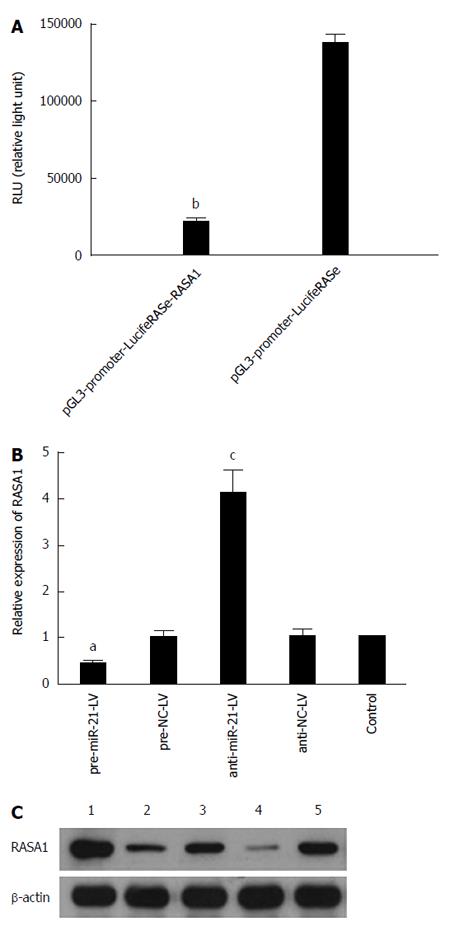
Figure 3 MiR-21 negatively regulates RAS p21 GTPase activating protein 1.
A: Luciferase reporter gene assay showed lower RLU values in pre-miR-21-LV cells co-transfected with pGL3-promoter-LucifeRASe-RASA1 in comparison with cells co-transfected with pGL3-promoter-LucifeRASe (n = 3, bP < 0.01); B: qRT-PCR detection of RASA1 mRNA levels in cells with up/down-regulated miR-21 (n = 3, aP < 0.05 vs control; cP < 0.05 vs control); C: Western blot was used to assess RASA1 protein levels in cells with up/down-regulated miR-21. 1: anti-miR-21-LV; 2: anti-NC-LV; 3: control; 4: pre-miR-21-LV; 5: pre-NC-LV. RASA1: RAS p21 GTPase activating protein 1; NC: Non-coding; LV: Lentivirus.
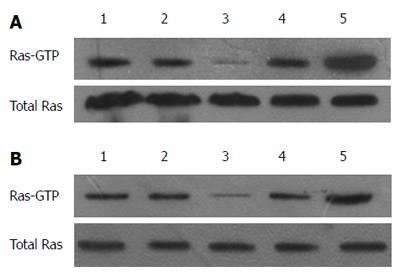
Figure 4 MiR-21 and RAS p21 GTPase activating protein 1 regulate RAS-GTP activity.
Immunoprecipitation was used to assess the change in RAS-GTP activity in cells with up/down-regulated miR-21 or RASA1. A: 1: Control; 2: anti-NC-LV; 3: anti-miR-21-LV; 4: pre-NC-LV; 5: pre-miR-21-LV; B: 1: Control; 2: RASA1NC; 3: pcDNA3.1-RASA1; 4: siRASA1 NC; 5: siRASA1.
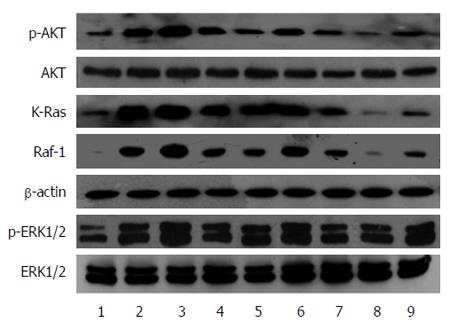
Figure 5 Role of miR-21 and RAS p21 GTPase activating protein 1 in the regulation of RAS signaling pathways.
Western blot was used to assess the regulatory effect of miR-21 and RASA1. 1: pcDNA3.1-RASA1; 2: RASA1 NC; 3: siRASA1; 4: siRASA1NC; 5: Control; 6: pre-miR-21-LV; 7: pre-NC-LV; 8: anti-miR-21-LV; 9: anti-NC-LV. RASA1: RAS p21 GTPase activating protein 1; NC: Non-coding; LV: Lentivirus.
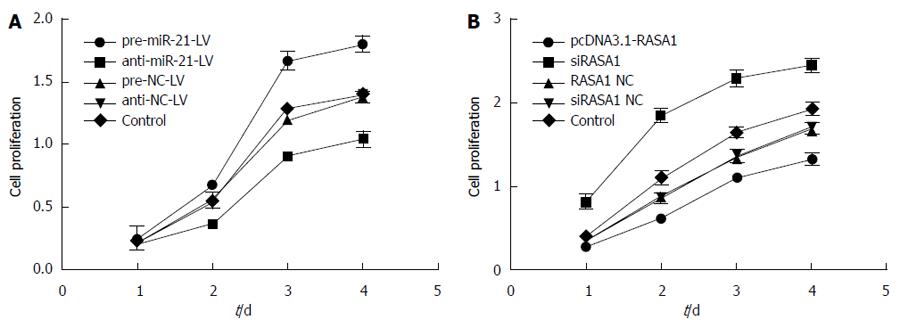
Figure 6 MiR-21 and RAS p21 GTPase activating protein 1 regulate RKO cell proliferation.
A: Cell proliferation was assessed by MTT after miR-21 up/down-regulation; B: Cell proliferation was assessed by MTT after RASA1 up/down-regulation. Down-regulation of miR-21 or up-regulation of RASA1 inhibited cell proliferation (n = 6). RASA1: RAS p21 GTPase activating protein 1; NC: Non-coding; LV: Lentivirus.
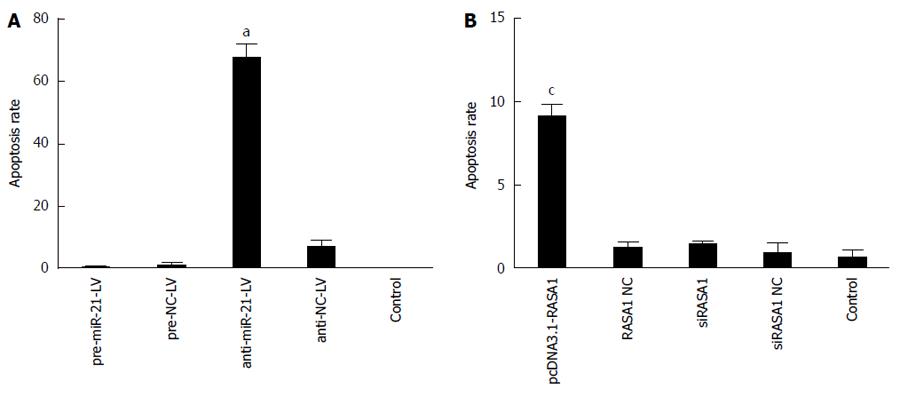
Figure 7 MiR-21 modulates apoptosis via RAS p21 GTPase activating protein 1 regulation.
An annexin V-PE/7-AAD apoptosis detection kit was used to assess cell apoptosis in RKO cells in each group by flow cytometry. n = 3, aP < 0.05 vs pre-miR-21-LV; cP < 0.05 vs siRASA1. RASA1: RAS p21 GTPase activating protein 1; NC: Non-coding; LV: Lentivirus.
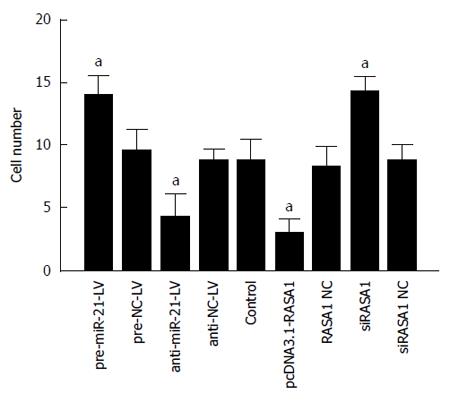
Figure 8 Role of miR-21 and RAS p21 GTPase activating protein 1 in cell invasion was detected by Transwell assays.
Down-regulation of miR-21 or up-regulation of RASA1 inhibited cell invasion. n = 3, aP < 0.01 vs control. RASA1: RAS p21 GTPase activating protein 1; NC: Non-coding; LV: Lentivirus.
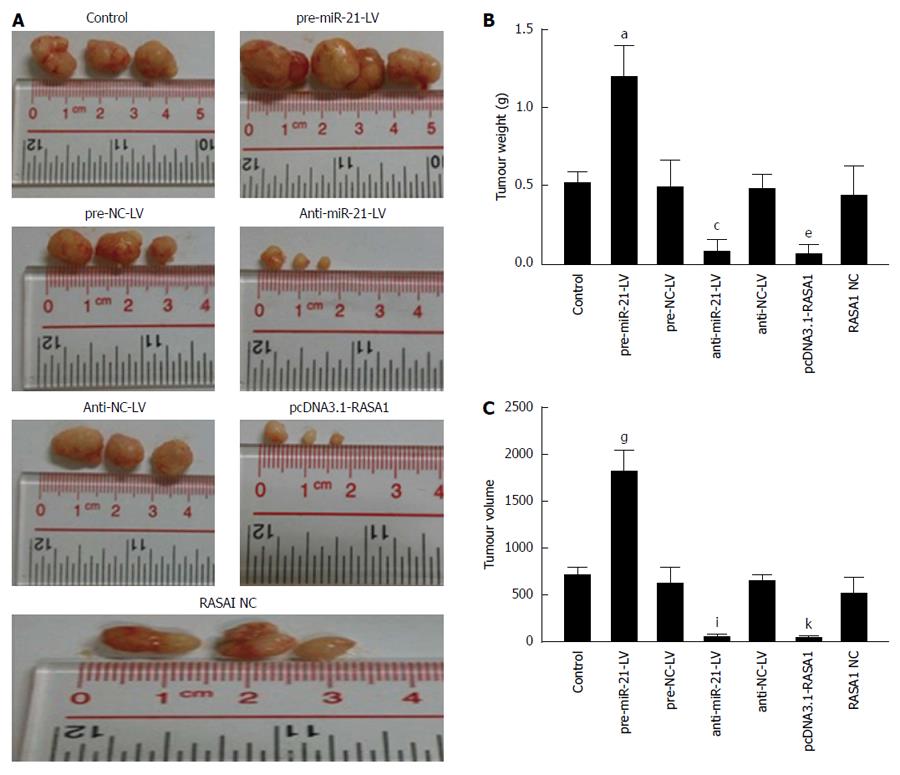
Figure 9 Oncogenicity of miR-21 and RAS p21 GTPase activating protein 1 in a nude mouse tumor transplantation model.
A: The tumors were excised 30 d post-implantation; B: Tumor weights at 30 d post-implantation. aP < 0.05 vs control; n = 3, cP < 0.05 vs control; eP < 0.05 vs control; C: Tumor volumes at 30 d post-implantation. n = 3, gP, iP, kP < 0.05 vs control. RASA1: RAS p21 GTPase activating protein 1; NC: Non-coding; LV: Lentivirus.
-
Citation: Gong B, Liu WW, Nie WJ, Li DF, Xie ZJ, Liu C, Liu YH, Mei P, Li ZJ. MiR-21/RASA1 axis affects malignancy of colon cancer cells
via RAS pathways. World J Gastroenterol 2015; 21(5): 1488-1497 - URL: https://www.wjgnet.com/1007-9327/full/v21/i5/1488.htm
- DOI: https://dx.doi.org/10.3748/wjg.v21.i5.1488


