Copyright
©The Author(s) 2015.
World J Gastroenterol. Dec 14, 2015; 21(46): 13042-13054
Published online Dec 14, 2015. doi: 10.3748/wjg.v21.i46.13042
Published online Dec 14, 2015. doi: 10.3748/wjg.v21.i46.13042
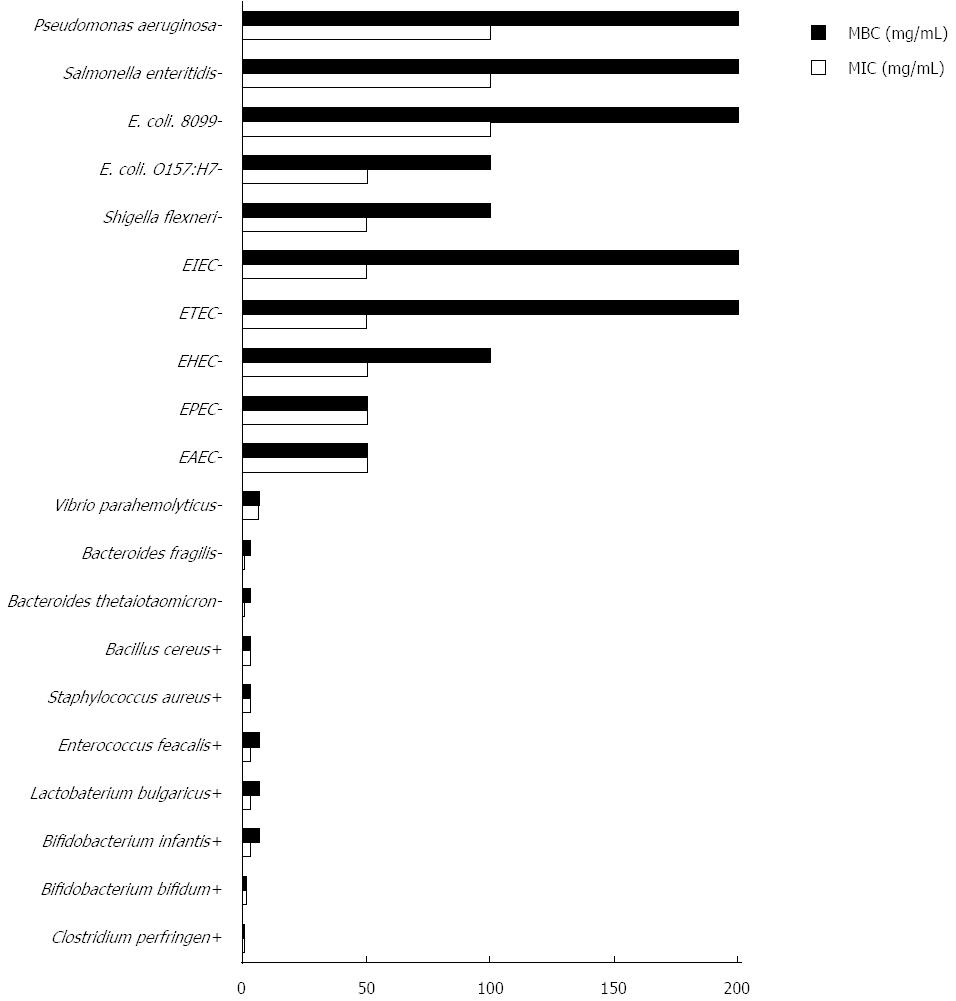
Figure 1 Antimicrobial activity of Ligustrum robustum on gut bacteria.
MIC: Minimum inhibitory concentration; MBC: Minimum bactericidal concentration; -: Gram negative bacteria; +: Gram positive bacteria; EAEC: Entero-aggregative Escherichia coli; EHEC: Entero-hemorrhagic Escherichia coli; ETEC: Entero-toxigenic Escherichia coli; EPEC: Entero-pathogenic Escherichia coli; EIEC: Entero-invasive Escherichia coli.
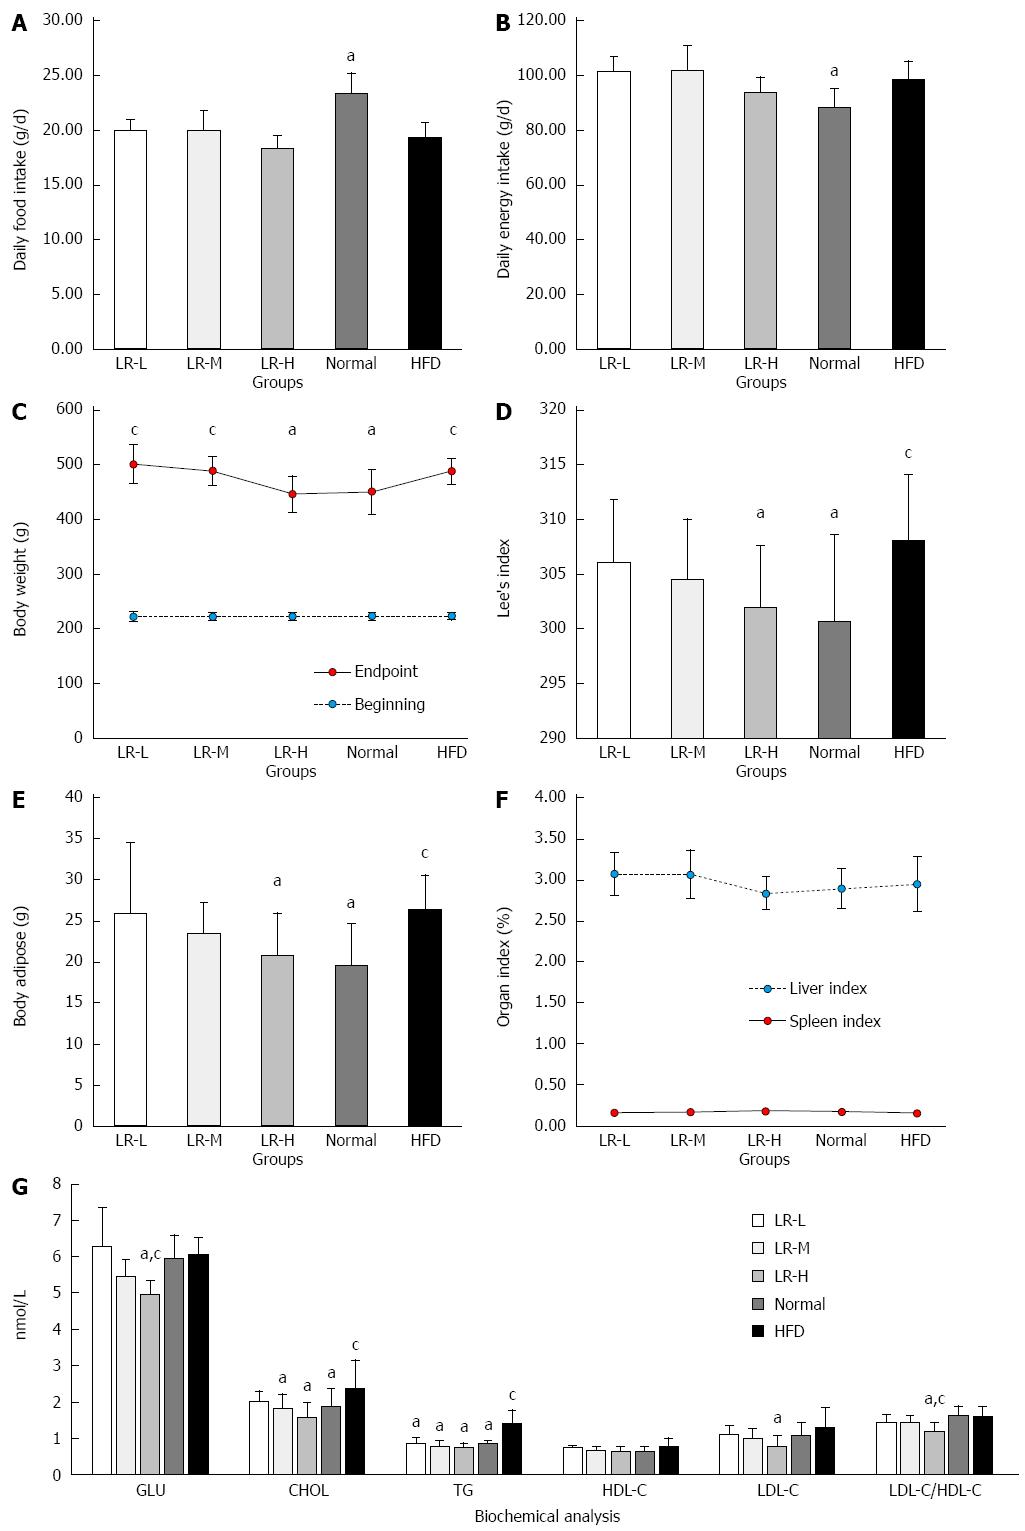
Figure 2 Effects of Ligustrum robustum on macroscopic obesity related parameters.
A: Daily food intake; B: Daily energy intake; C: Body weight; D: Lee’s index; E: Body adipose; F: Liver index and Spleen index; G: Blood glucose and lipid. Normal: Normal chow diet-fed mice; HFD: High-fat diet-fed control mice; LR-L/M/H: Low-, medium- and high-dose of Ligustrum robustum aqueous extract-treated HFD rats; n = 10 for LR-L, LR-M, LR-H; n = 9 for Normal and HFD; aP < 0.05 vs HFD group; cP < 0.05 vs Normal group.
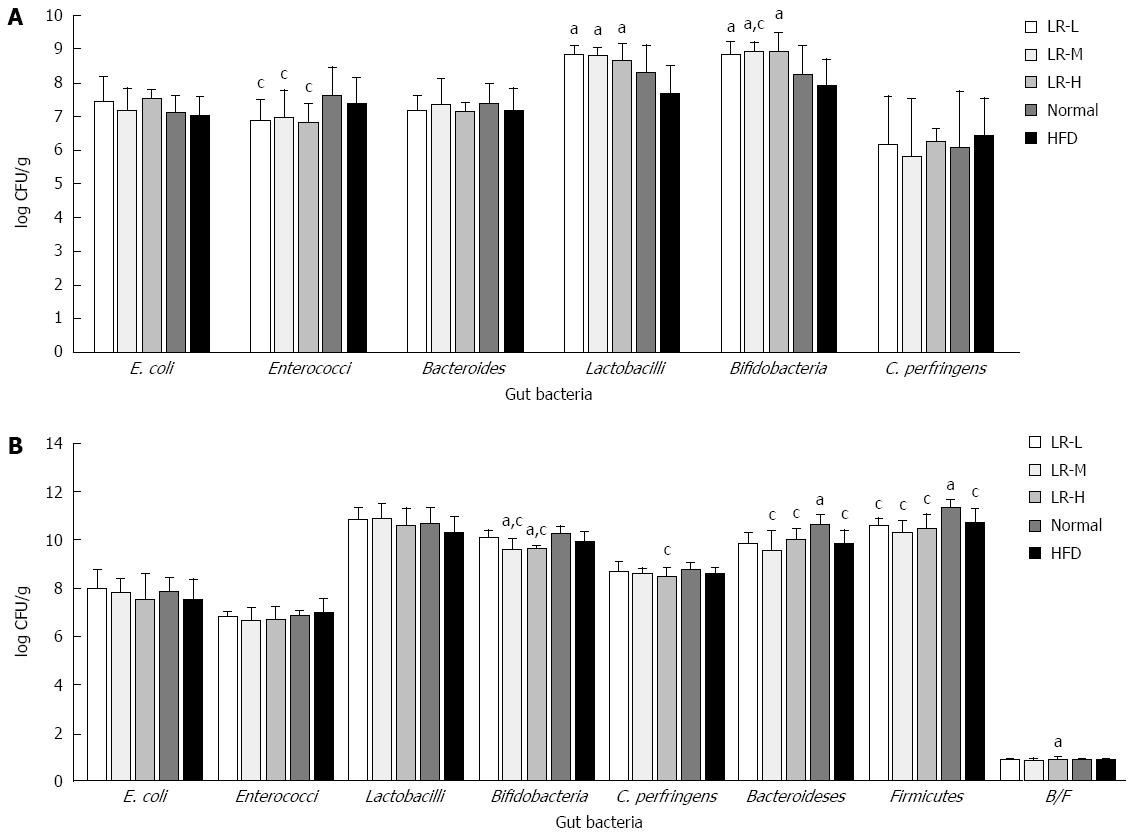
Figure 3 Effect of Ligustrum robustum on gut bacteria.
A: Viable counts of six gut bacteria; B: 16S rRNA relative gene expression of gut bacteria. Normal: Normal chow diet-fed mice; HFD: High-fat diet-fed control mice; LR-L/M/H: Low-, medium- and high-dose of Ligustrum robustum aqueous extract-treated HFD rats; B/F: Bacteroidetes/Firmicutes; n = 10 for LR-L, LR-M, LR-H; n = 9 for Normal and HFD; aP < 0.05 vs HFD group; cP < 0.05 vs Normal group.
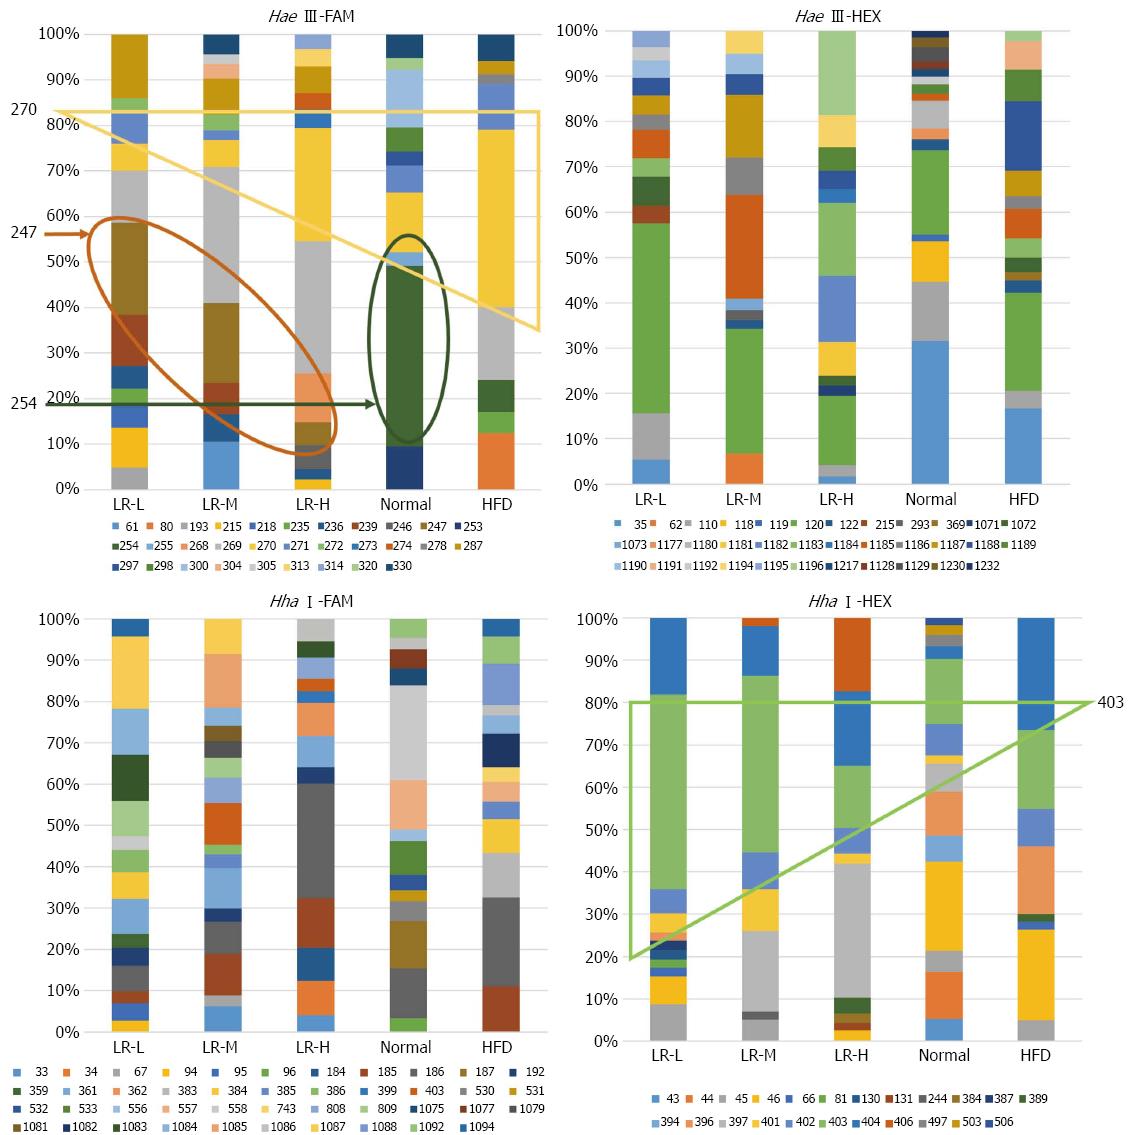
Figure 4 Results of terminal-restriction fragment length polymorphism analyses.
Normal: Normal chow diet-fed mice; HFD: High-fat diet-fed control mice; LR-L/M/H: Low-, medium- and high-dose of Ligustrum robustum aqueous extract-treated HFD rats; Peaks > 15 bp with more than 1% abundance of bacterial 16S rRNA gene fragments retrieved from four different treatments. Hae III (Hha I)-FAM (HEX): Purified PCR products digested by the restriction enzyme Hae III (Hha I) with FAM (HEX)-labeled DNA fragments separated by capillary electrophoresis; the length of T-RFs in base pairs (bp) is indicated; n = 10 for LR-L, LR-M, LR-H; n = 9 for Normal and HFD.
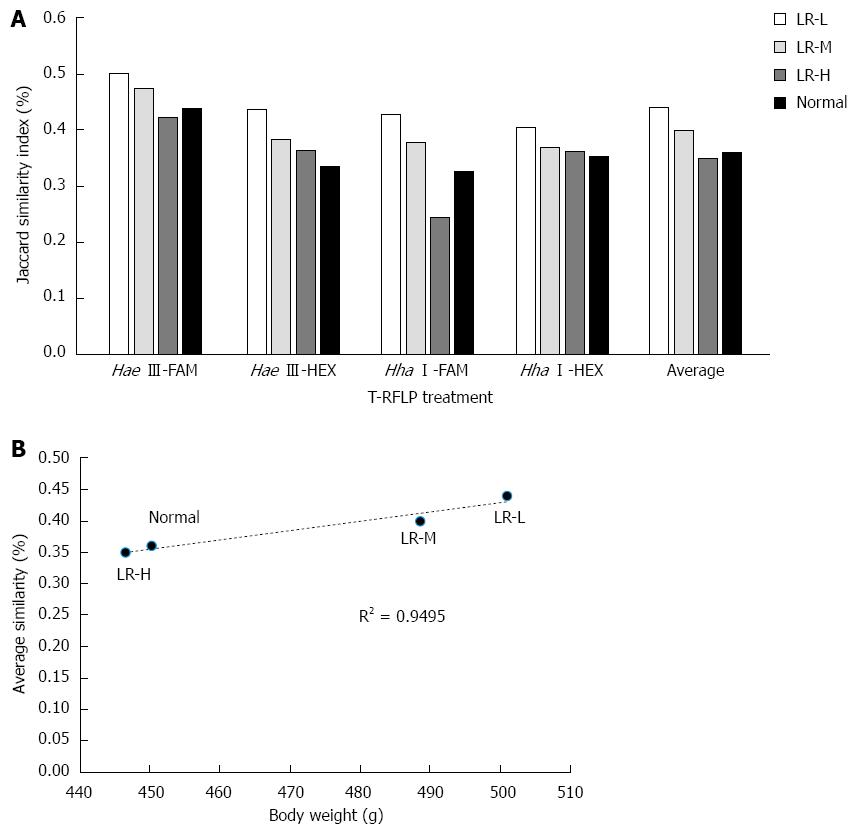
Figure 5 Similarity of gut microbiota compared with the obese group.
A: The Jaccard similarity index of T-RFs in the HFD group and the other groups; B: Correlation of body weight with average similarity. Normal: Normal chow diet-fed mice; HFD: High-fat diet-fed control mice; LR-L/M/H: Low-, medium- and high-dose of Ligustrum robustum aqueous extract-treated HFD rats; Hae III (Hha I)-FAM (HEX): Purified PCR products digested by the restriction enzyme Hae III (Hha I) with FAM (HEX)-labeled DNA fragments separated by capillary electrophoresis; n = 10 for LR-L, LR-M, LR-H; n = 9 for Normal and HFD.
-
Citation: Xie ZM, Zhou T, Liao HY, Ye Q, Liu S, Qi L, Huang J, Zuo HJ, Pei XF. Effects of
Ligustrum robustum on gut microbes and obesity in rats. World J Gastroenterol 2015; 21(46): 13042-13054 - URL: https://www.wjgnet.com/1007-9327/full/v21/i46/13042.htm
- DOI: https://dx.doi.org/10.3748/wjg.v21.i46.13042


