Copyright
©The Author(s) 2015.
World J Gastroenterol. Dec 7, 2015; 21(45): 12814-12821
Published online Dec 7, 2015. doi: 10.3748/wjg.v21.i45.12814
Published online Dec 7, 2015. doi: 10.3748/wjg.v21.i45.12814
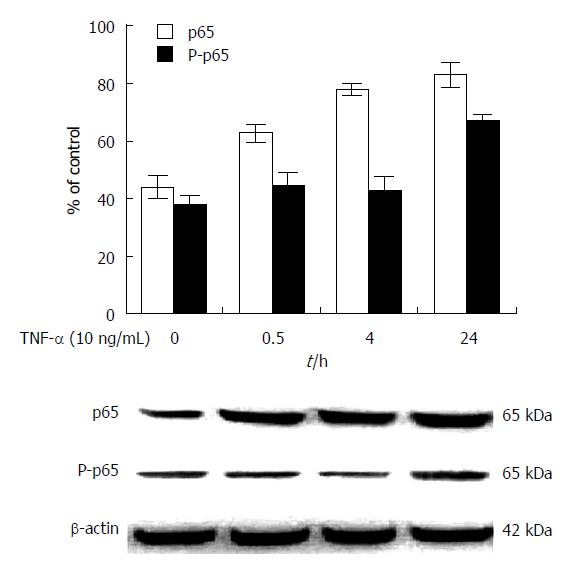
Figure 1 Comparative analysis of nuclear factor-κB/p65 and P-p65 expression in human HepG2 cells induced with tumor necrosis factor-α.
A: The ratios of nuclear factor-κB (NF-κB) p65 and P-p65 expression to β-actin in HepG2 cells with 10 ng/mL of tumor necrosis factor (TNF)-α at time points, data are means of independent triplicate experiments; B: The expression of NF-κB/p65 and P-p65 by Western blot analysis, NF-κB/p65 and P-p65 were 65 kDa, and β-actin, the control, was 42 kDa.
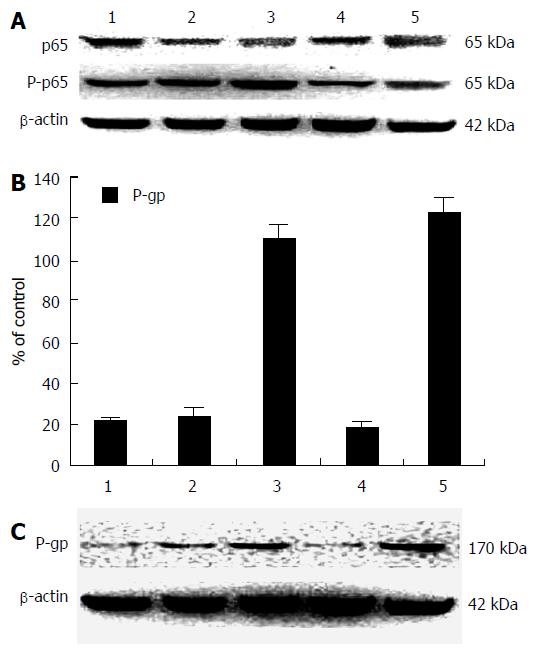
Figure 2 Expressions of nuclear factor-κB/p65, P-p65, and P-gp induced by different doses of doxorubicin in HepG2 cells.
Lane 1, control without doxorubicin; Lane 2, 0.5 μmol/L of doxorubicin for 4 h; Lane 3, 0.5 μmol/L of doxorubicin for 24 h; Lane 4, 1.0 μmol/L of doxorubicin for 4 h; and Lane 5, 1.0 μmol/L of doxorubicin for 24 h. A: The expressions of NF-κB/p65 and P-p65 in HepG2 cells with different doses of doxorubicin were analyzed by western blotting. NF-κB/p65 and P-p65 shows a 65 kDa band, and β-actin shows a 42 kDa band as control; B: The relative levels of P-glycoprotein (P-gp) expression to β-actin in HepG2 cells with different doses of doxorubicin at different times, data are means of independent triplicate experiments; C: the analysis of P-gp expression in HepG2 cells with different doses of doxorubicin by western blotting. P-gp, 170 kDa; β-actin, 42 kDa as control protein. The action time of HepG2 cells with different doses of doxorubicin.
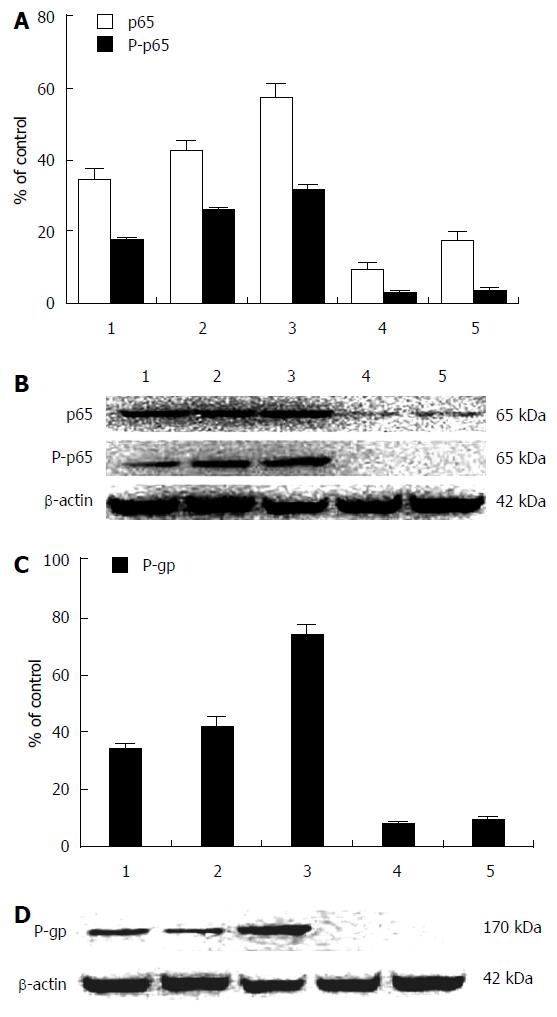
Figure 3 Downregulation of nuclear factor-κB/p65, P-p65, and P-gp expression in HepG2 cells after siRNA transfection.
1, control; 2, negative-siRNA for 48 h; 3, 0.5 μmol/L of doxorubicin for 48 h; 4, nuclear factor-κB (NF-κB)/p65 siRNA for 48 h; 5, 100 nmol/L of NF-κB/p65 siRNA for 24 h, then added 0.5 μmol/L of doxorubicin for another 24 h. A: The ratios of NF-κB/p65 and P-p65 expression in HepG2 cells after NF-κB/p65 siRNA transfection, data are means of independent triplicate experiments; B: The analysis of NF-κB/p65 and P-p65 expression in HepG2 cells after NF-κB/p65 siRNA transfection by western blotting; C: The relative levels of P-gp expression in HepG2 cells after NF-κB/p65 siRNA transfection, all values are means of independent triplicate experiments; D: The analysis of P-gp expression in HepG2 cells after NF-κB/p65 siRNA transfection by western blotting. The molecular weight NF-κB/p65, P-p65, and P-gp were 65 kDa, 65 kDa, and 170 kDa, respectively; and β-actin, molecular weight 42 kDa, was the control protein.
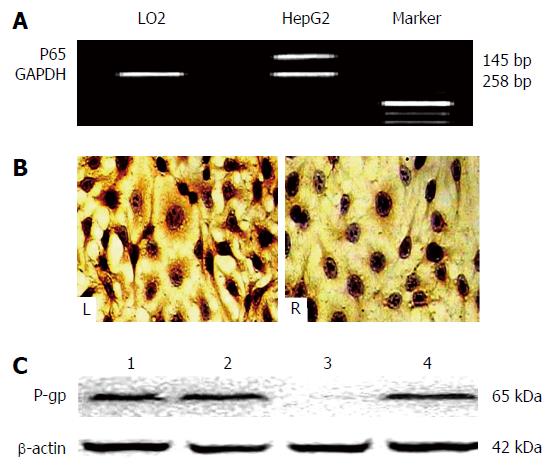
Figure 4 Expression of nuclear factor-κB or nuclear factor-κB/p65 mRNA in HepG2 cells before and after siRNA transfection.
A: The expression of nuclear factor (NF)-κB/p65 mRNA was higher in HepG2 cells than LO2 cells before siRNA transfection. The fragments (145 bp) of NF-κB/p65 mRNA were amplified by reverse transcription polymerase chain reaction, separated on 2% agarose gel, and stained with ethidium bromide; B: Immunohistochemical staining with anti-NF-κB/p65 (streptavidin-peroxidase, original magnification × 40); NF-κB/p65 positive material was a brown-yellow fine particle layer and localized in the cytoplasm and nucleus of HepG2 cells (L); the expression of NF-κB/p65 positive material in the cytoplasm and nucleus of HepG2 cells with siRNA transfection (R); C: Western-blotting of NF-κB/p65 in cytoplasm and nucleus of HepG2 cells with siRNA transfection. Lanes 1, cytoplasm of HepG2 cells; Lanes 2, nucleus of HepG2 cells; Lanes 3, cytoplasm of HepG2 cells with 100 nmol/L of siRNA transfection; and Lanes 4, nucleus of HepG2 cells with 100 nmol/L of siRNA transfection. p65, 65 kDa; β-actin, 42 kDa, as the control protein.
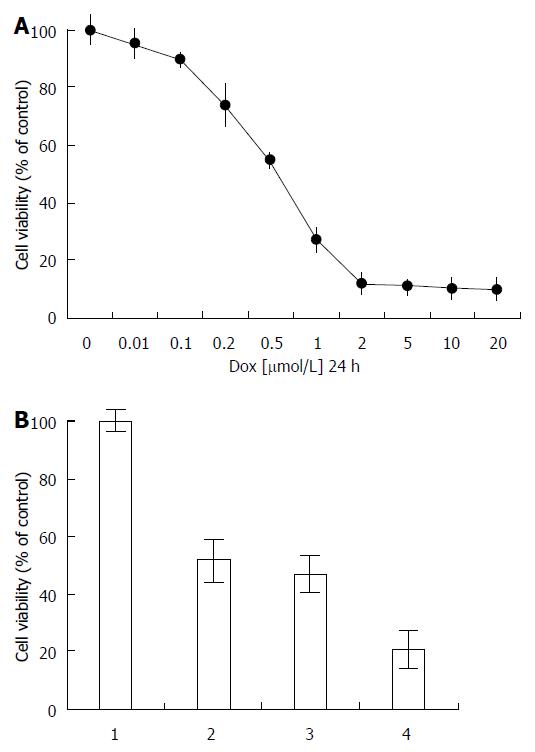
Figure 5 The viability of human HepG2 cells with doxorubicin after nuclear factor-κB/p65 siRNA transfection.
A: The effects of doxorubicin on HepG2 cells by MTT assay during a 24 h period. All values are means of independent triplicate experiments. Dox, doxorubicin; B: Nuclear factor-κB (NF-κB)/ siRNA inhibition of NF-κB/p65 sensitized the HepG2 cells to doxorubicin, 1, control; 2, 0.5 μmol/L of doxorubicin for 48 h; 3, negtive siRNA for 24 h, then added 0.5 μmol/L of doxorubicin for another 24 h; 4, 100 nmol/L of NF-κB/p65 siRNA for 24 h, then added 0.5 μmol/L of doxorubicin for another 24 h. Data were derived from three independent experiments (n = 3).
- Citation: Shi Y, Wang SY, Yao M, Sai WL, Wu W, Yang JL, Cai Y, Zheng WJ, Yao DF. Chemosensitization of HepG2 cells by suppression of NF-κB/p65 gene transcription with specific-siRNA. World J Gastroenterol 2015; 21(45): 12814-12821
- URL: https://www.wjgnet.com/1007-9327/full/v21/i45/12814.htm
- DOI: https://dx.doi.org/10.3748/wjg.v21.i45.12814


