Copyright
©The Author(s) 2015.
World J Gastroenterol. Oct 21, 2015; 21(39): 11152-11159
Published online Oct 21, 2015. doi: 10.3748/wjg.v21.i39.11152
Published online Oct 21, 2015. doi: 10.3748/wjg.v21.i39.11152
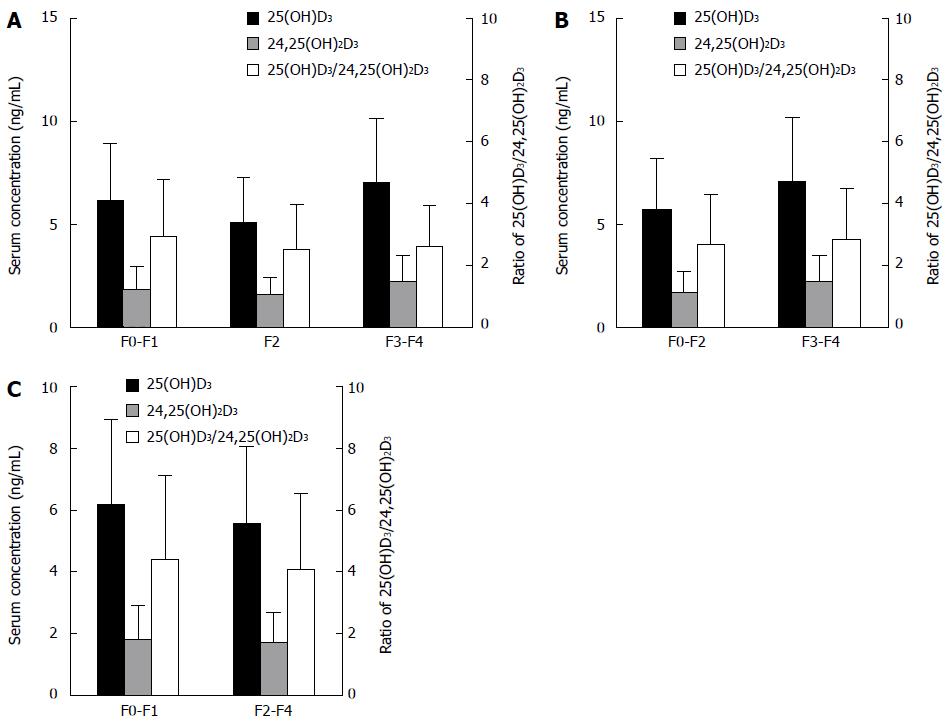
Figure 1 Serum vitamin D levels in chronic hepatitis C patients with different stages of fibrosis.
Serum 25(OH)D3 and 24,25(OH)2D3 levels, and the 25(OH)D3/24,25(OH)2D3 ratio, among subgroups of patients with different stages of fibrosis. A: F0-F1 vs F2 vs F3-F4; B: F0-F2 vs F3-F4; C: F0-F1 vs F2-F4.
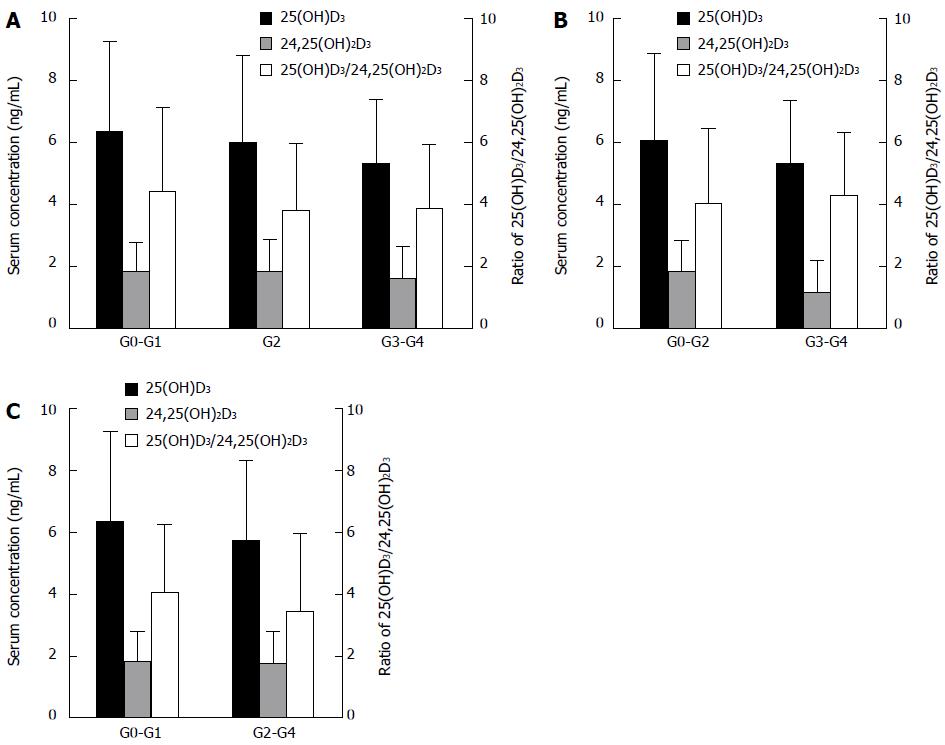
Figure 2 Serum vitamin D levels in chronic hepatitis C patients with different grades of liver inflammation.
Serum 25(OH)D3 and 24,25(OH)2D3 levels, and the 25(OH)D3/24,25(OH)2D3 ratio, among subgroups of patients with different grades of liver inflammation. A: G0-G1 vs G2 vs G3-G4; B: G0-G2 vs G3-G4; C: G0-G1 vs G2-G4.
- Citation: Ren Y, Liu M, Zhao J, Ren F, Chen Y, Li JF, Zhang JY, Qu F, Zhang JL, Duan ZP, Zheng SJ. Serum vitamin D3 does not correlate with liver fibrosis in chronic hepatitis C. World J Gastroenterol 2015; 21(39): 11152-11159
- URL: https://www.wjgnet.com/1007-9327/full/v21/i39/11152.htm
- DOI: https://dx.doi.org/10.3748/wjg.v21.i39.11152


