Copyright
©The Author(s) 2015.
World J Gastroenterol. Sep 28, 2015; 21(36): 10385-10399
Published online Sep 28, 2015. doi: 10.3748/wjg.v21.i36.10385
Published online Sep 28, 2015. doi: 10.3748/wjg.v21.i36.10385
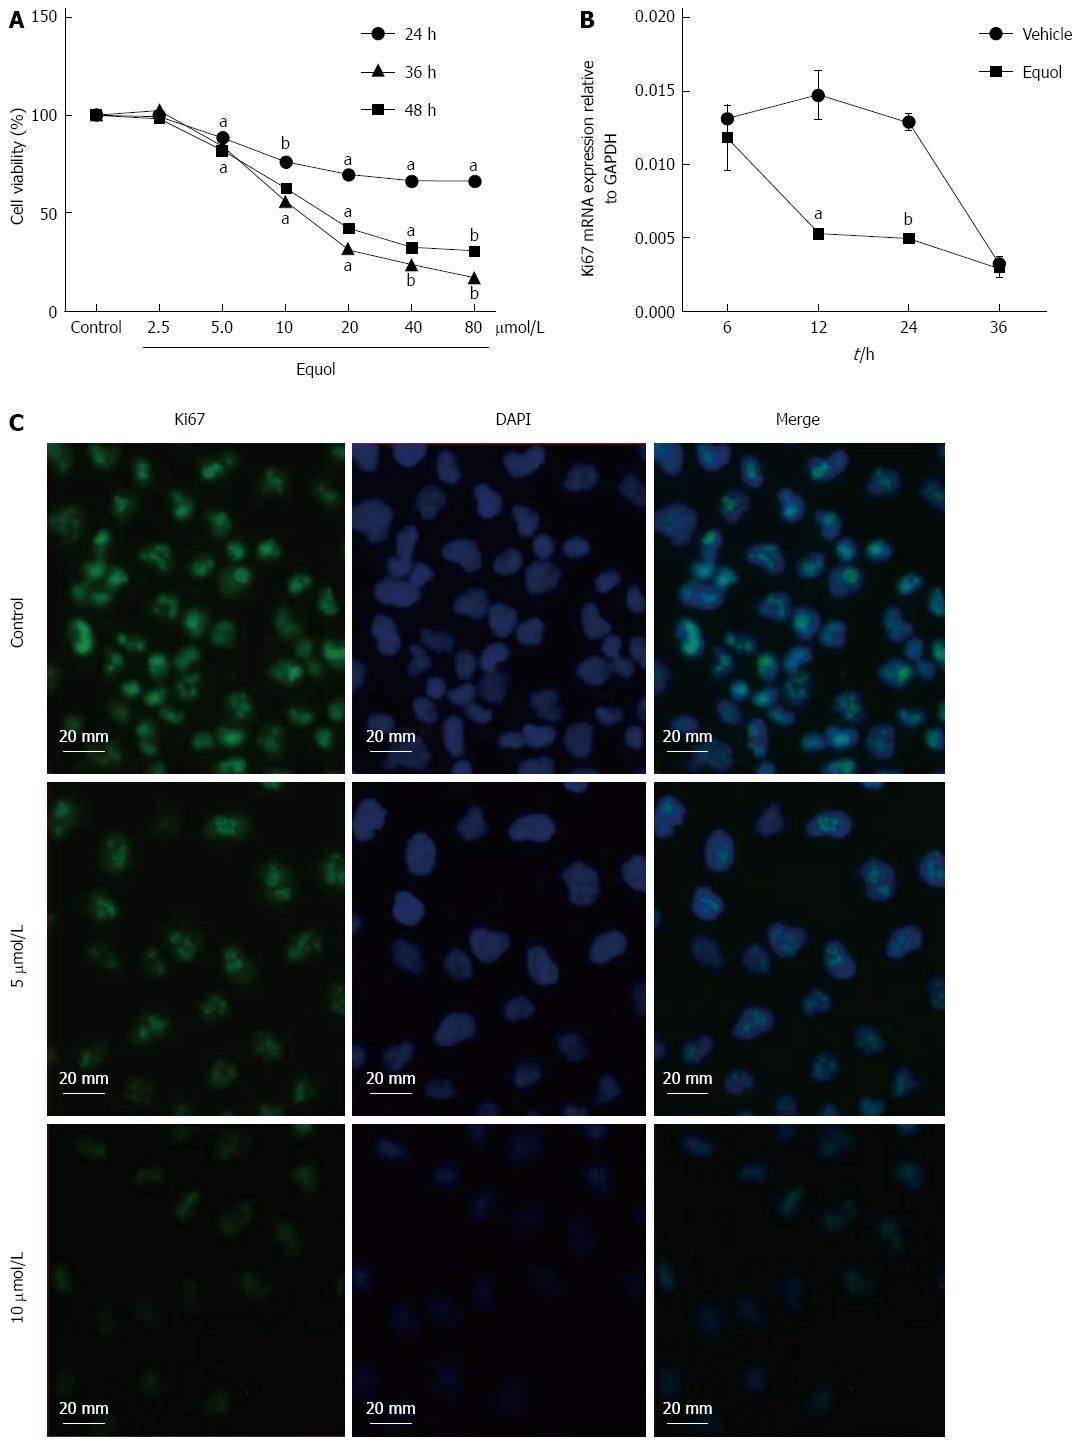
Figure 1 Effect of equol on the proliferation of MGC-803 cells.
A: Cells were treated with various concentrations of equol for 24, 36 and 48 h, and cell viability was determined via MTS assay. The viability of the control group was arbitrarily set at 100%; B: Ki67 mRNA expression after 20 μmol/L of equol treatment for desired time; C: Immunofluorescent detection of Ki67 level (magnification × 200). Cells were stimulated with desired doses of equol for 24 h. Detection of ki67 was conducted as described in “Materials and methods” (aP < 0.05 vs control, bP < 0.01 vs control).
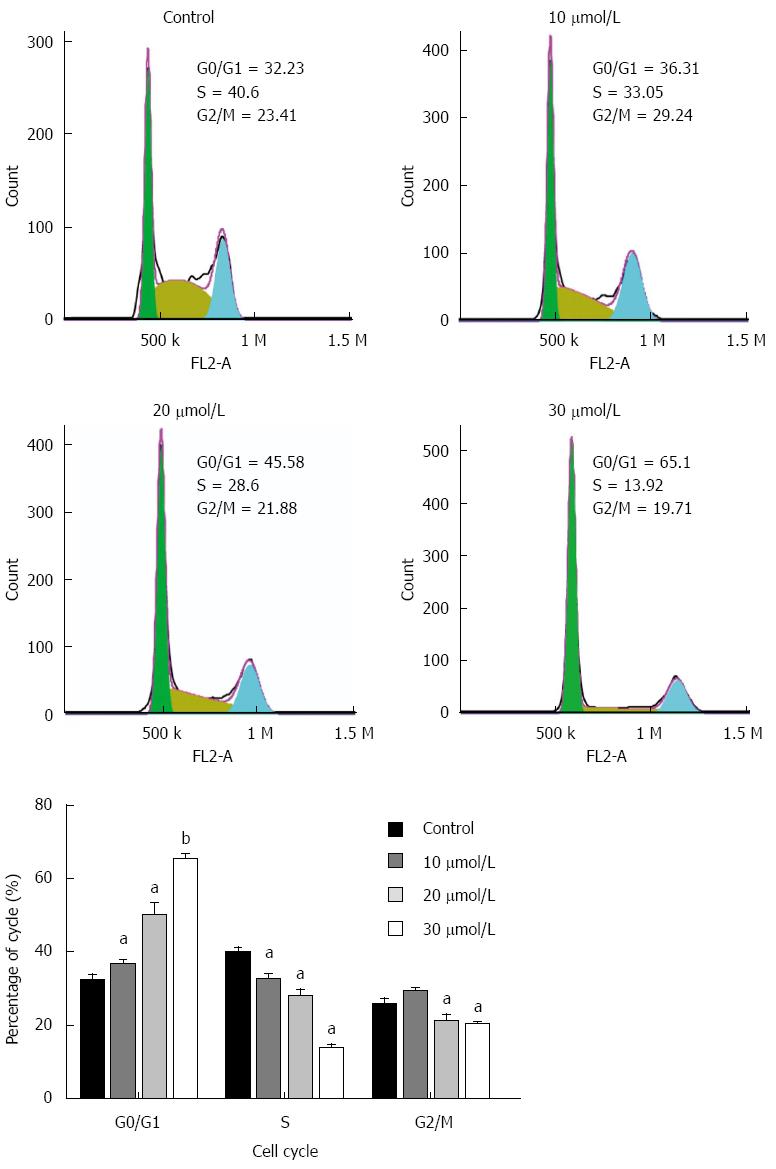
Figure 2 Cell cycle analysis of equol-treated cells.
MGC-803 cells were treated with various concentrations of equol for 24 h. The cell cycle distribution was determined by flow cytometry (aP < 0.05 vs control; bP < 0.01 vs control).
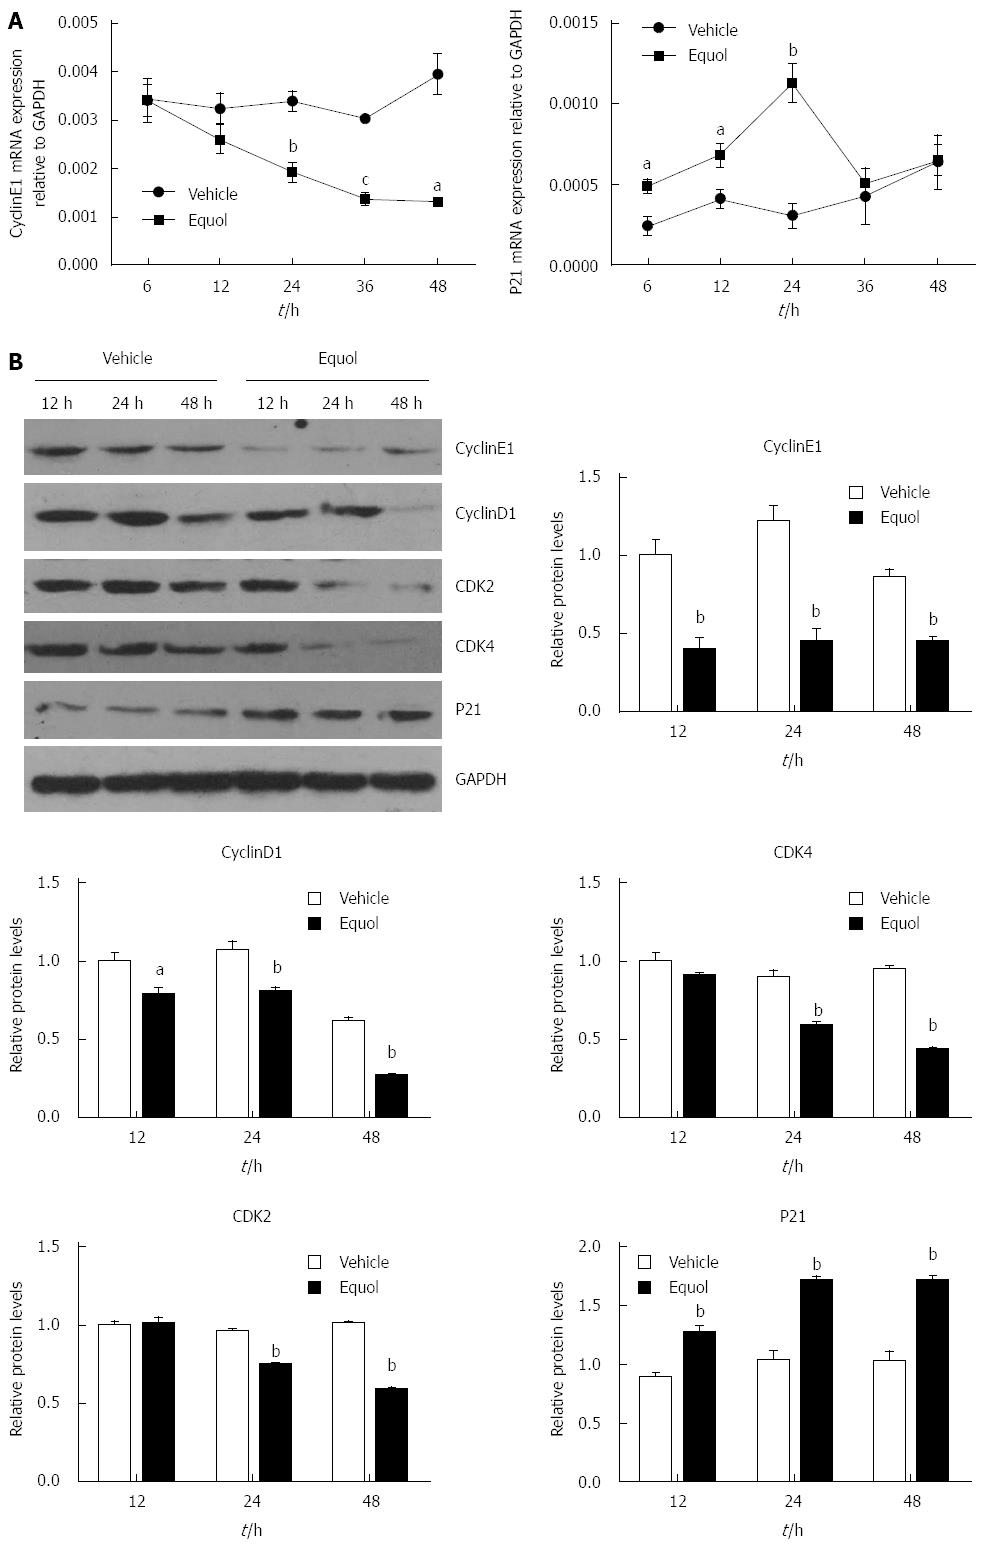
Figure 3 Effect of equol on the expression of cell cycle regulators.
Cells were treated with 20 μmol/L of equol for different durations. A: The mRNA expression of cell cycle regulators was detected by q-PCR; B: The levels of cell cycle regulatory proteins were determined by Western blot assay (aP < 0.05 vs control, bP < 0.01 vs control, cP < 0.001 vs control).
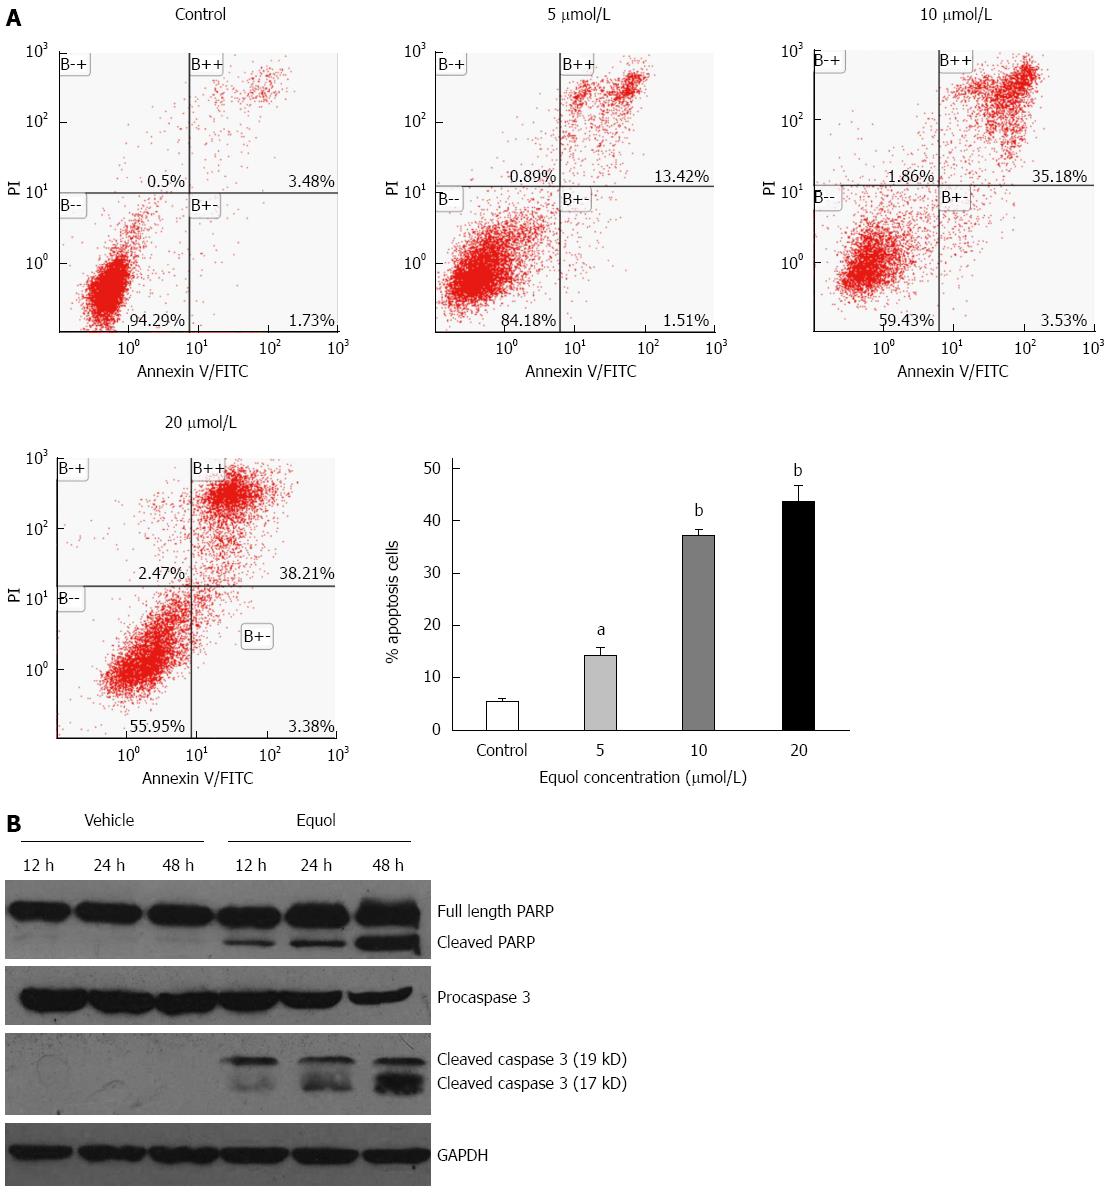
Figure 4 Apoptotic effect of equol on MGC-803 cells.
A: Cells were treated with different concentrations of equol for 48 h, then subjected to Annexin V/PI apoptosis assay as described in “Materials and methods”; B: The effect of equol on the expression of end point markers of apoptosis. Cells were treated with 20 μmol/L of equol for different durations. Then, cells were harvested, and the expression of cleaved PARP and caspase-3 was determined by Western blot analysis. GAPDH antibody was utilized as a loading control (aP < 0.05 vs control; bP < 0.01 vs control).
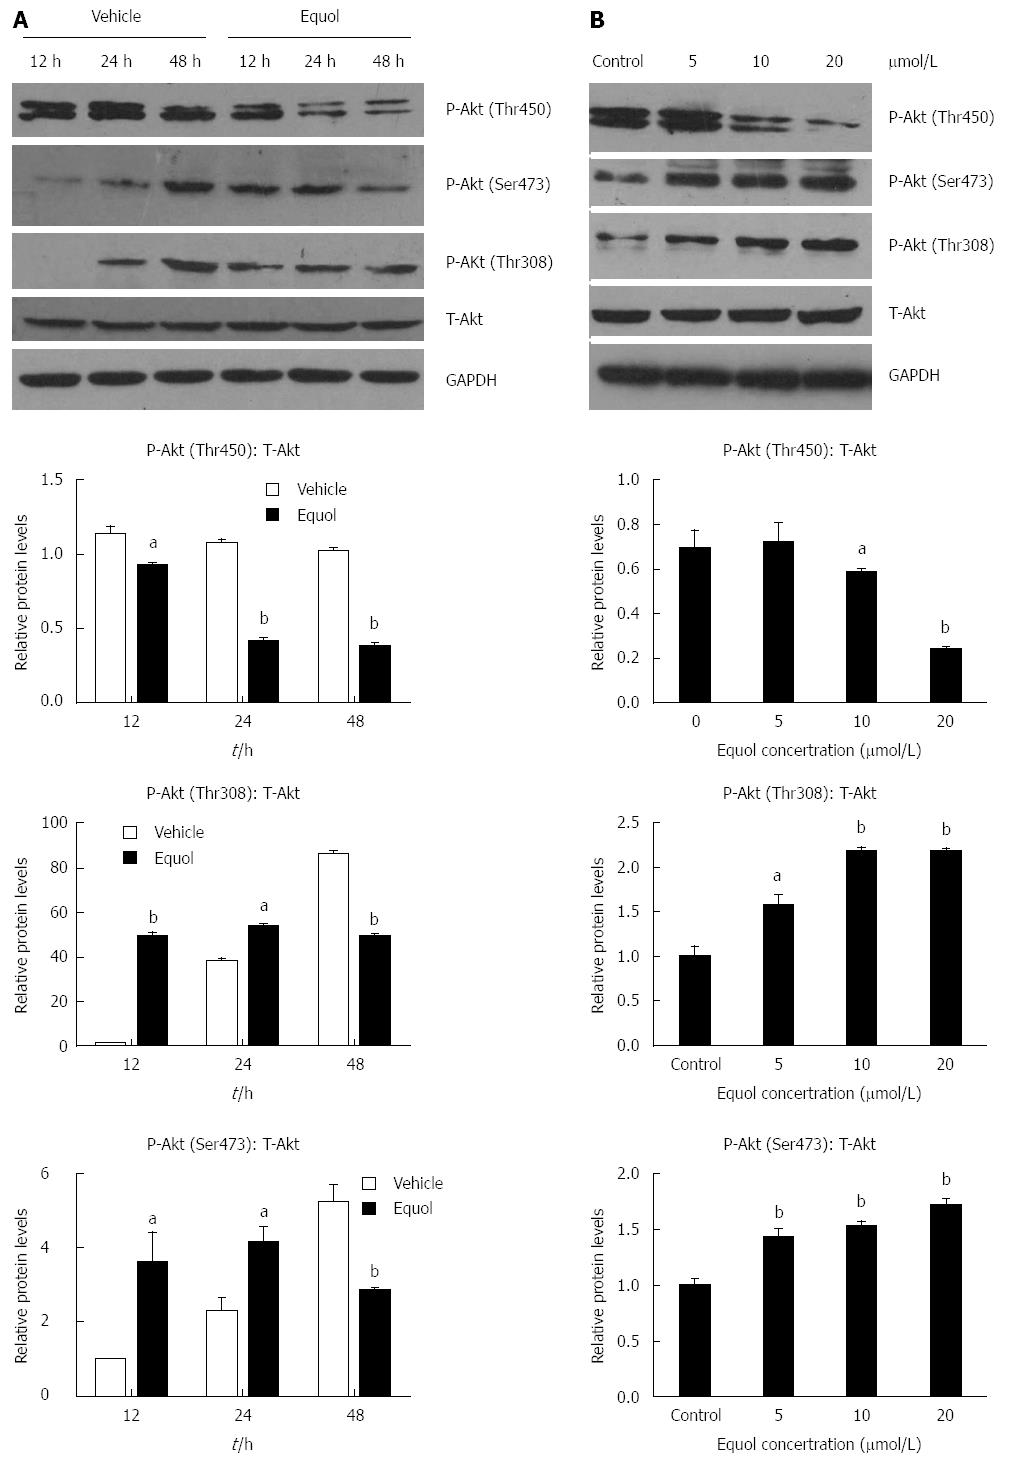
Figure 5 Effect of equol on Akt phosphorylation.
A: Cells were treated with 20 μmol/L of equol for 12, 24 and 48 h; B: Cells were treated with various concentrations of equol for 24 h. The levels of phosphorylated Akt (Thr450, Thr308 and Ser473) and total Akt were detected by Western blot. GAPDH was utilized as a loading control (aP < 0.05 vs control; bP < 0.01 vs control).
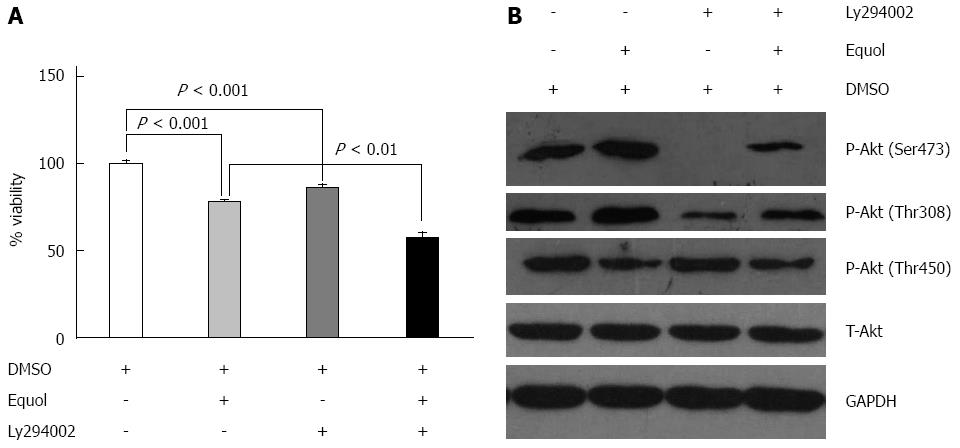
Figure 6 Inhibition of Akt phosphorylation and its effect on cell viability.
MGC-803 cells were pretreated with 20 μmol/L Ly294002 for 1 h prior to treatment with 20 μmol/L equol for 24 h. A: The cell viability was determined by MTS assay; B: The levels of phosphorylated Akt (Thr450, Thr308 and Ser473) were detected by Western blot.
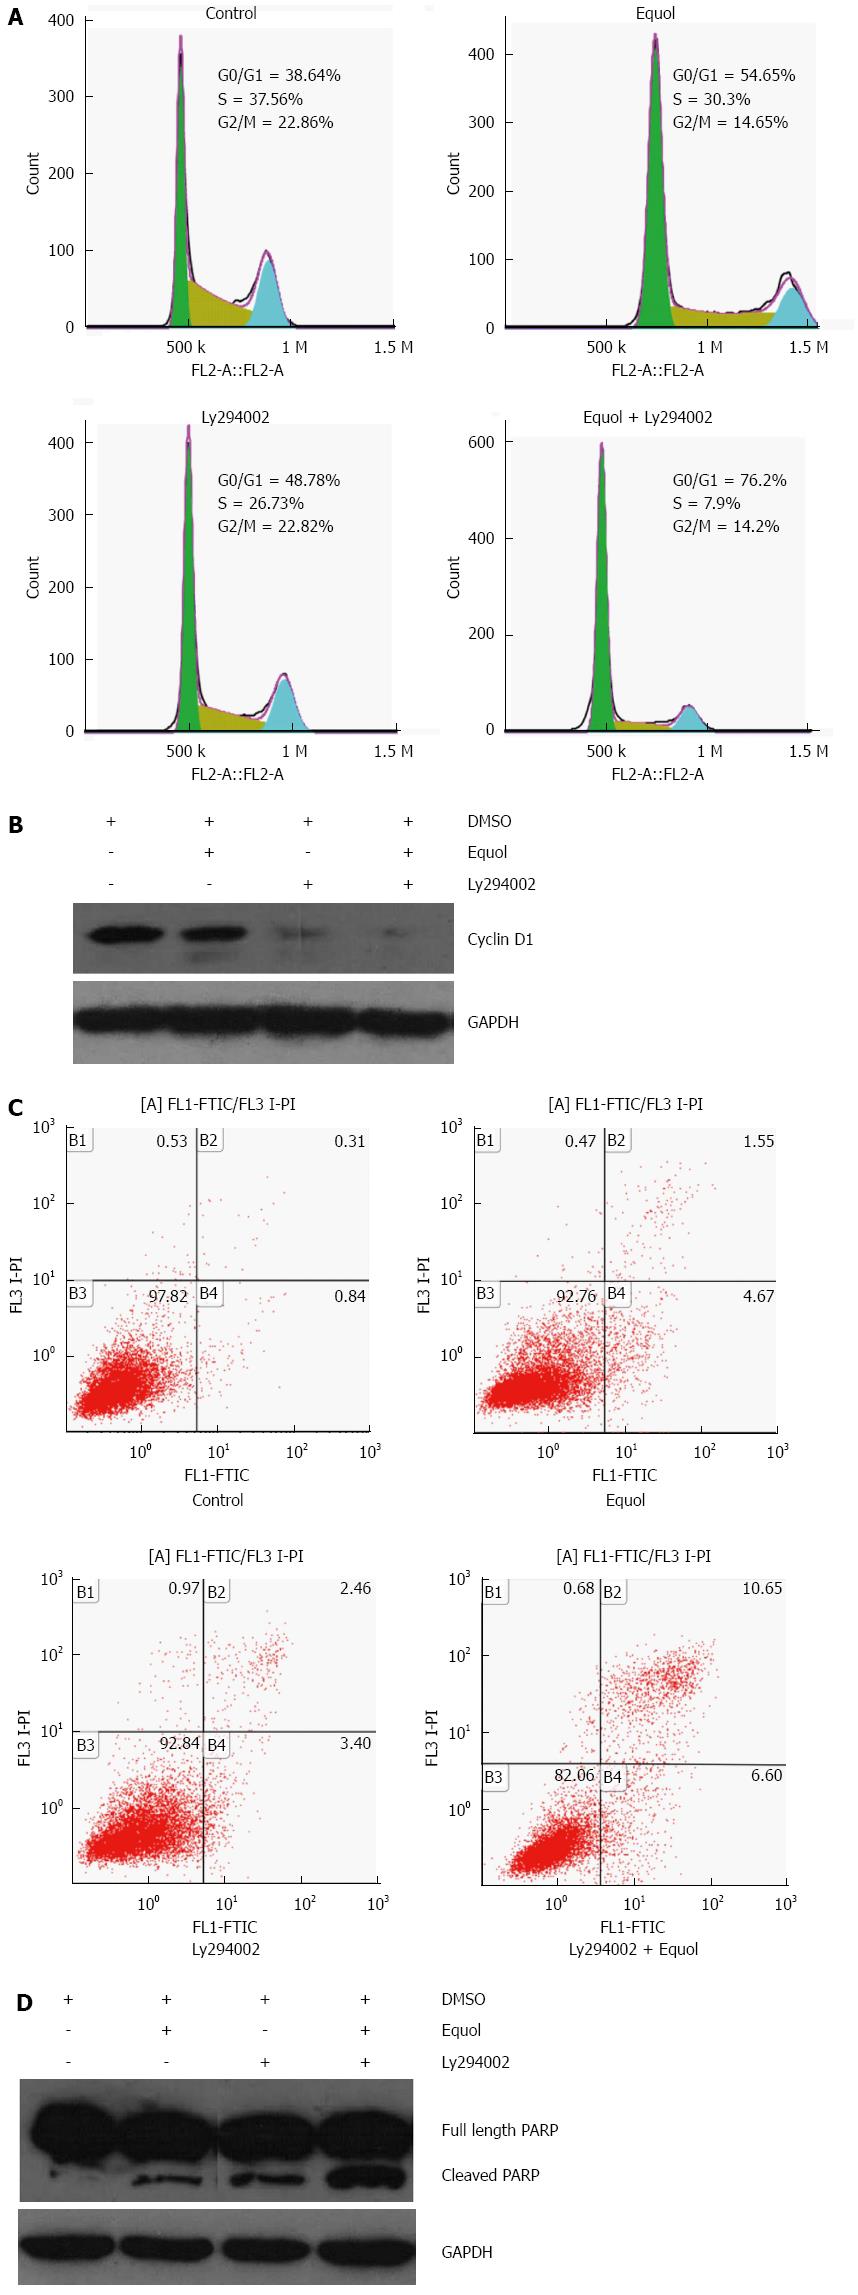
Figure 7 Effect of Akt inhibition on equol-exerted G0/G1 phase arrest and apoptosis.
MGC-803 cells were pretreated with 20 μmol/L Ly294002 for 1 h prior to treatment with 20 μmol/L equol for 24 h. The cell cycle distribution (A) and apoptotic cells (B) were examined by flow cytometry. The levels of Cyclin D1 (C) and the cleavage of PARP (D) were detected by Western blot.
-
Citation: Yang ZP, Zhao Y, Huang F, Chen J, Yao YH, Li J, Wu XN. Equol inhibits proliferation of human gastric carcinoma cells
via modulating Akt pathway. World J Gastroenterol 2015; 21(36): 10385-10399 - URL: https://www.wjgnet.com/1007-9327/full/v21/i36/10385.htm
- DOI: https://dx.doi.org/10.3748/wjg.v21.i36.10385


