Copyright
©The Author(s) 2015.
World J Gastroenterol. Sep 28, 2015; 21(36): 10375-10384
Published online Sep 28, 2015. doi: 10.3748/wjg.v21.i36.10375
Published online Sep 28, 2015. doi: 10.3748/wjg.v21.i36.10375
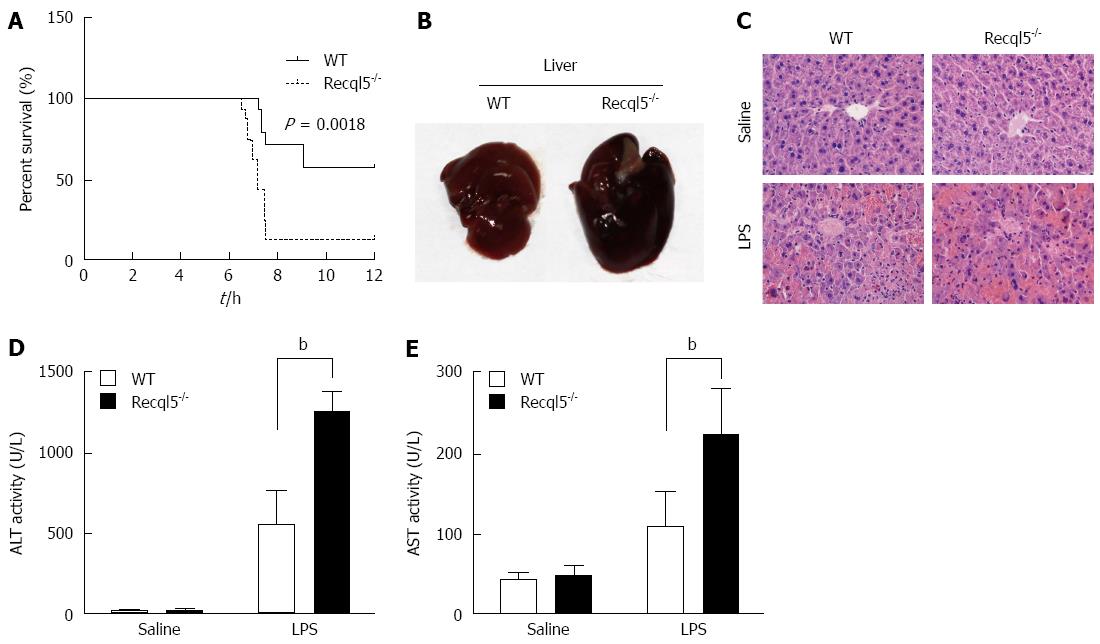
Figure 1 Enhanced lipopolysaccharide/D-Gal-induced liver injury in Recql5-deficient mice.
A: Survival curves after lipopolysaccharide (LPS)/D-Gal injection. Wild type (WT) and Recql5-deficient (Recql5-/-) mice were treated with 20 μg/kg LPS and 400 mg/kg D-Gal (WT, n = 14; KO, n = 16). Survival curves were created using the Kaplan-Meier method and compared by log-rank (Mantel-Cox) test; B: Images of the whole livers demonstrate the different degree of hemorrhage. WT and Recql5-deficient mice were treated with 300 mg/kg D-Gal and 10 μg/kg LPS (n = 4-7 per group). Livers were removed 6 h after injection; C: HE staining of liver sections 6 h after injection; D: Serum alanine transaminase (ALT) activity 6 h after injection; E: Serum aspartate transaminase (AST) activity 6 h after treatment. bP < 0.01, WT vs Recql5-/-.
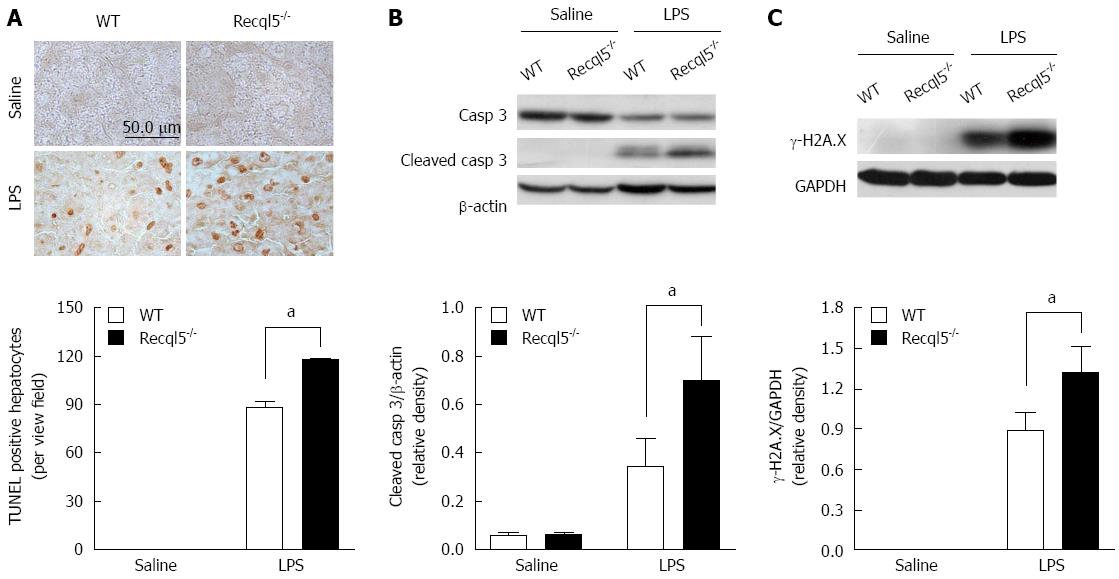
Figure 2 Enhanced hepatocellular apoptosis in Recql5-deficient mice after lipopolysaccharide/D-Gal treatment.
A: TUNEL assay for apoptotic hepatocytes in wild type (WT) and Recql5-deficient (Recql5-/-) mice after lipopolysaccharide (LPS)/D-Gal injection; B: Western blot analysis of cleaved caspase-3 protein levels in the livers of WT and Recql5-deficient mice in response to LPS/D-Gal; C: Western blot analysis of γ-H2A.X levels in the livers of WT and Recql5-deficient mice in response to LPS/D-Gal. aP < 0.05, WT vs Recql5-/-.
Figure 3 Enhanced inflammatory responses in Recql5-deficient mice following lipopolysaccharide/D-Gal exposure.
TNF-α (A) and IL-6 (B) mRNA expression in WT and Recql5-deficient (Recql5-/-) mice 1 and 6 h after LPS/D-Gal exposure (n = 4-7 per group). Serum TNF-α (C) and IL-6 (D) levels in WT and Recql5-deficient mice 1 and 6 h after LPS/D-Gal administration; E: Hepatic MPO activity in WT and Recql5-deficient mice following LPS/D-Gal challenge; F: Western blot analysis of ERK1/2, JNK, and p65 expression and phosphorylation in the livers of WT and Recql5-deficient mice after LPS/D-Gal treatment. aP < 0.05, WT vs Recql5-/-.
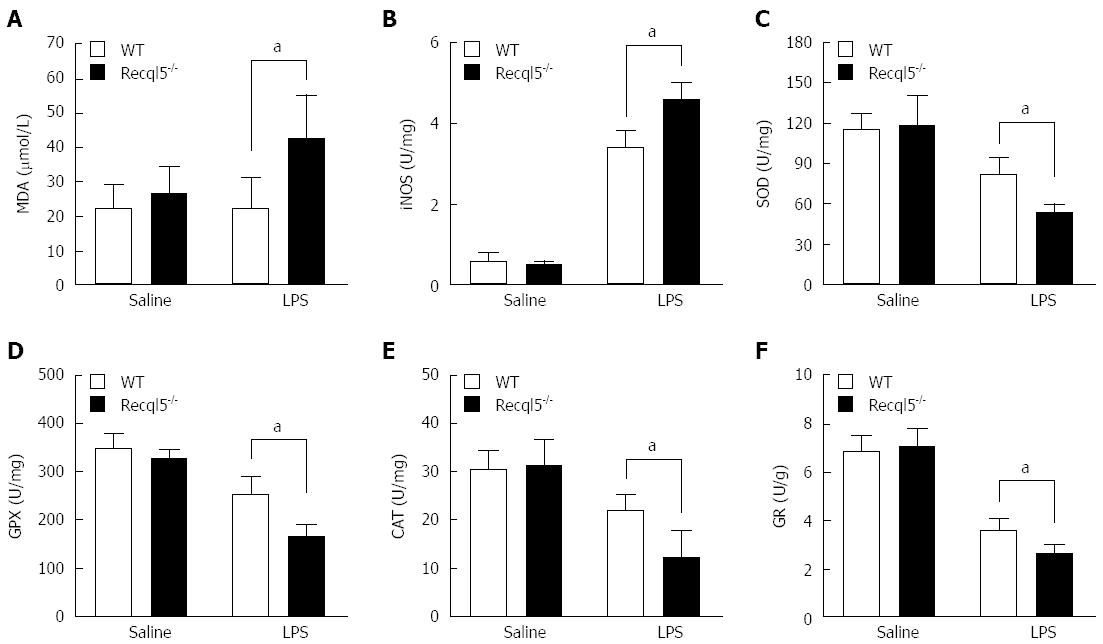
Figure 4 Enhanced oxidative stress in Recql5-deficient mice after lipopolysaccharide/D-Gal treatment.
A: Serum MDA contents in WT and Recql5-deficient (Recql5-/-) mice 6 h after lipopolysaccharide (LPS)/D-Gal injection. Liver iNOS (B), SOD (C), GPX (D), CAT (E), and GR (F) activity in WT and Recql5-deficient mice 6 h after LPS/D-Gal administration. n = 4-7 per group. aP < 0.05, WT vs Recql5-/-.
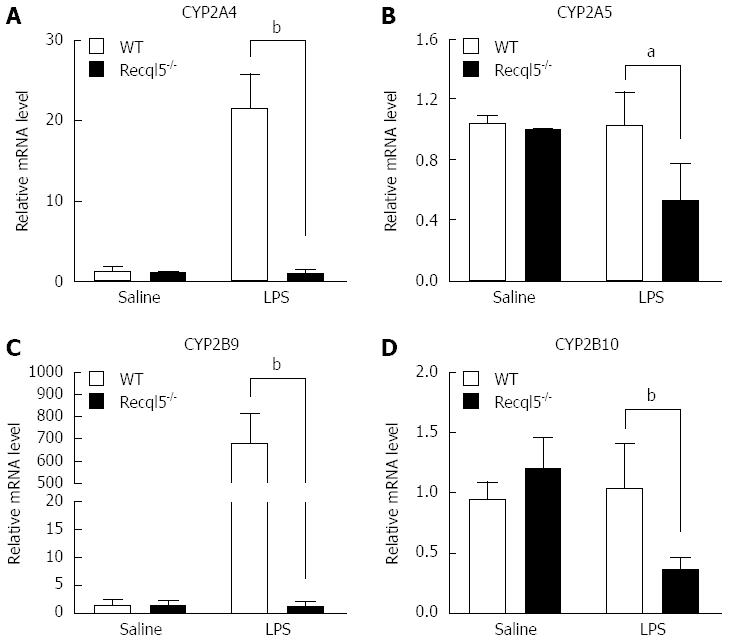
Figure 5 Downregulation of CYP450 in Recql5-deficient mice after lipopolysaccharide/D-Gal administration.
WT and Recql5-deficient (Recql5-/-) mice were injected with lipopolysaccharide (LPS)/D-Gal or saline, and livers were harvested at 6 h (n = 4-7 per group). RNA was isolated from the livers, and mRNA levels of CYP2A4 (A), CYP2A5 (B), CYP2B9 (C), and CYP2B10 (D) were measured by real-time quantitative PCR and normalized to GAPDH mRNA levels. aP < 0.05, bP < 0.01, WT vs Recql5-/-.
- Citation: Liao WQ, Qi YL, Wang L, Dong XM, Xu T, Ding CD, Liu R, Liang WC, Lu LT, Li H, Li WF, Luo GB, Lu XC. Recql5 protects against lipopolysaccharide/D-galactosamine-induced liver injury in mice. World J Gastroenterol 2015; 21(36): 10375-10384
- URL: https://www.wjgnet.com/1007-9327/full/v21/i36/10375.htm
- DOI: https://dx.doi.org/10.3748/wjg.v21.i36.10375


