Copyright
©The Author(s) 2015.
World J Gastroenterol. Aug 28, 2015; 21(32): 9648-9655
Published online Aug 28, 2015. doi: 10.3748/wjg.v21.i32.9648
Published online Aug 28, 2015. doi: 10.3748/wjg.v21.i32.9648
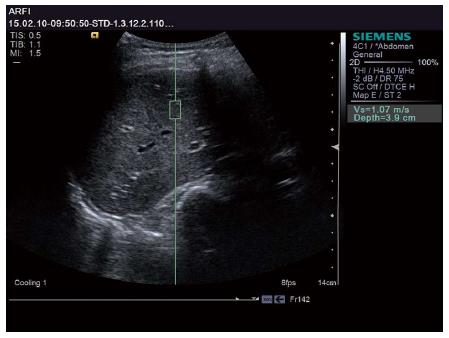
Figure 1 Patient with normal liver reserve function.
The Vs value was 1.07 m/s, ICG-R15 was 5.13% and ICG-K was 0.24 L/min. ICG: Indocyanine green.
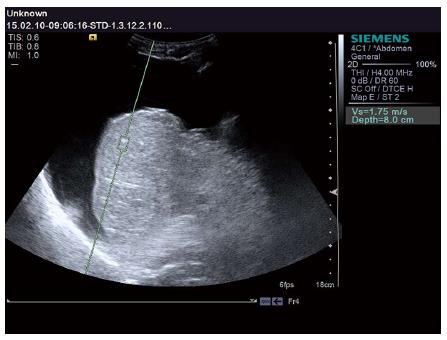
Figure 2 Patient with poor liver reserve function.
The Vs value was 1.75 m/s, ICG-R15 was 16.83% and ICG-K was 0.08 L/min. ICG: Indocyanine green.
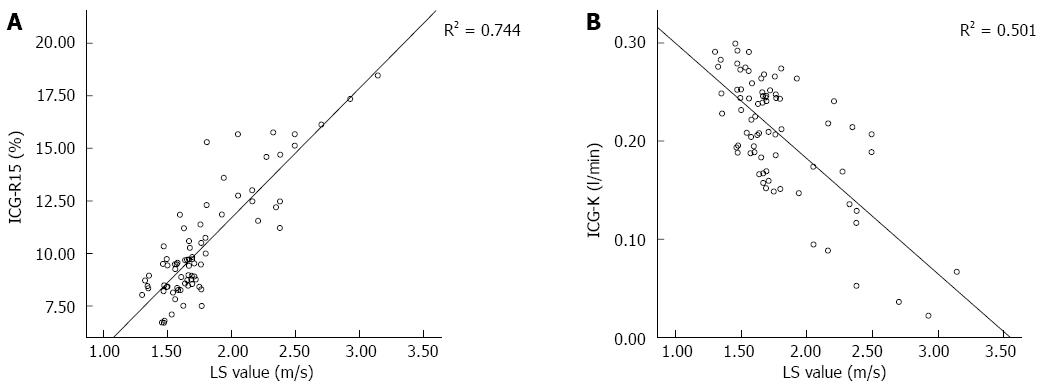
Figure 3 Correlations between liver stiffness and indocyanine green-R15 (A) or indocyanine-K (B) levels are shown.
LS: Liver stiffness.
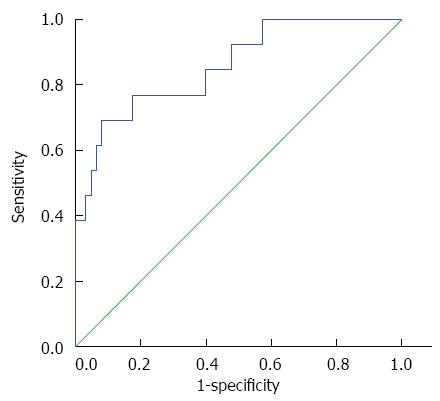
Figure 4 Receiver-operator characteristic curve used to analyze liver reserve function assessment accuracy.
When the liver stiffness value was 2.34 m/s, the Youden index was at its highest point, sensitivity was 69.2% and specificity was 92.1%.
- Citation: Sun XL, Liang LW, Cao H, Men Q, Hou KZ, Chen Z, Zhao YE. Liver reserve function assessment by acoustic radiation force impulse imaging. World J Gastroenterol 2015; 21(32): 9648-9655
- URL: https://www.wjgnet.com/1007-9327/full/v21/i32/9648.htm
- DOI: https://dx.doi.org/10.3748/wjg.v21.i32.9648


