Copyright
©The Author(s) 2015.
World J Gastroenterol. Jan 21, 2015; 21(3): 944-952
Published online Jan 21, 2015. doi: 10.3748/wjg.v21.i3.944
Published online Jan 21, 2015. doi: 10.3748/wjg.v21.i3.944
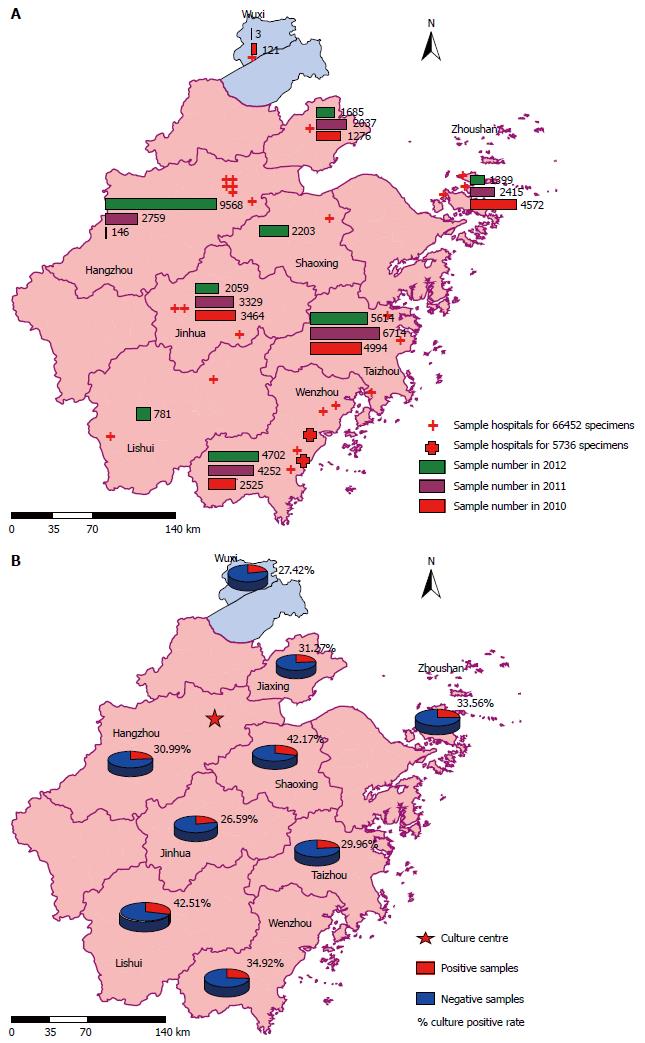
Figure 1 Distributions of samples and Helicobacter pylori positive culture rates.
A: Distribution of the 26 hospitals and sample numbers from 2010 to 2012 in each city; B: Positive rates in nine cities in Zhejiang and Jiangsu Provinces. The map was drawn by ARCGIS 9.3. software.
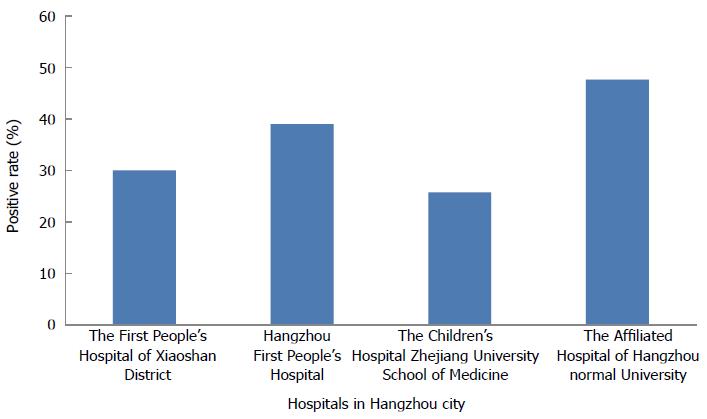
Figure 2 Positive culture rates in four different hospitals in Hangzhou.
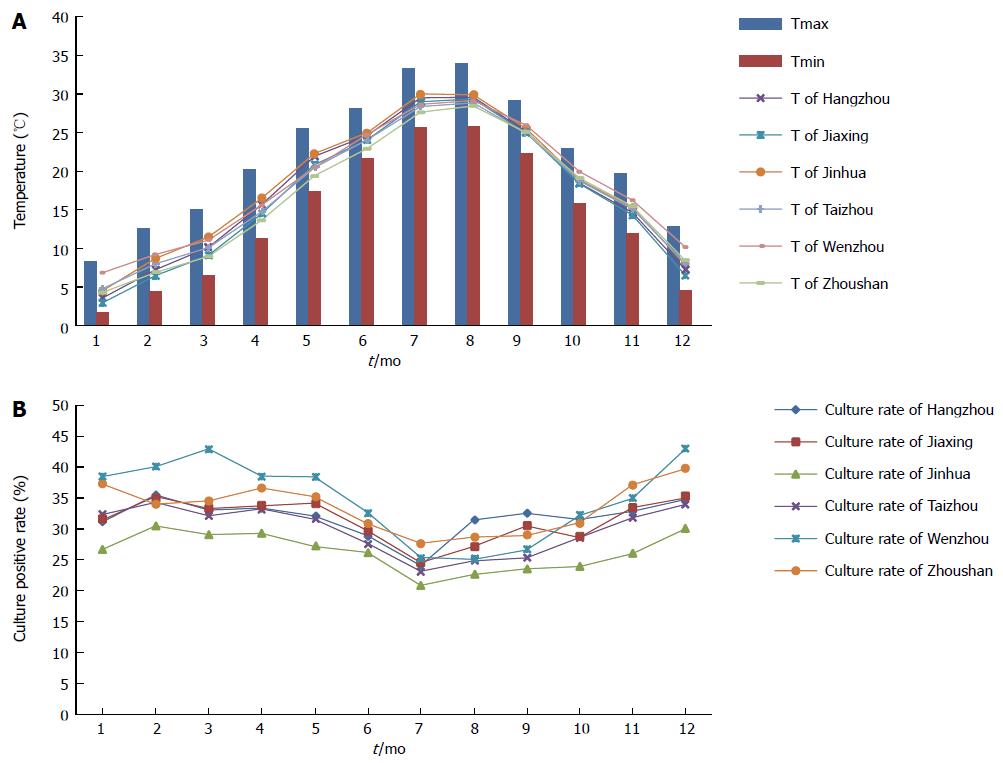
Figure 3 Temperatures and positive culture rate in six cities within three years.
A: The maximum (Tmax), minimum (Tmin) and average (T) temperatures; B: Positive culture rates.
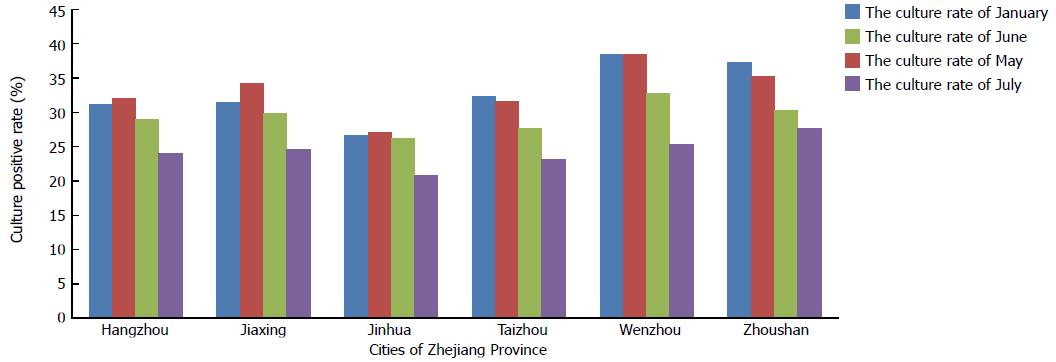
Figure 4 Positive culture rates of six cities in Zhejiang Province in January, May, June and July.
-
Citation: Gong YN, Li YM, Yang NM, Li HZ, Guo F, Lin L, Wang QY, Zhang JK, Ji ZZ, Mao JB, Mao JL, Shi ZC, Tang WH, Zhu XJ, Shao W, Zhang XF, Wang XH, Tong YF, Jiang MZ, Chen GL, Wang ZY, Tu HM, Jiang GF, Wu JS, Chen XP, Ding QL, Ouyang H, Jin FZ, Xu YL, Zhang JZ. Centralized isolation of
Helicobacter pylori from multiple centers and transport condition influences. World J Gastroenterol 2015; 21(3): 944-952 - URL: https://www.wjgnet.com/1007-9327/full/v21/i3/944.htm
- DOI: https://dx.doi.org/10.3748/wjg.v21.i3.944


