Copyright
©The Author(s) 2015.
World J Gastroenterol. Jan 21, 2015; 21(3): 888-896
Published online Jan 21, 2015. doi: 10.3748/wjg.v21.i3.888
Published online Jan 21, 2015. doi: 10.3748/wjg.v21.i3.888
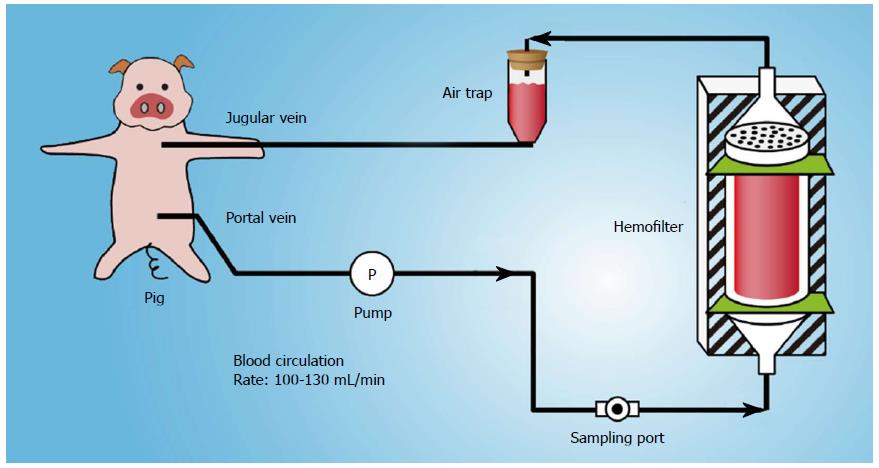
Figure 1 Schematic drawing of porta-caval diversion in the pig following hepatectomy.
This system comprises a whole-blood circulation loop, conversion pump and hemofilter. In this system, blood flows directly from the pig though the portal vein and is returned to the pig via the jugular vein.
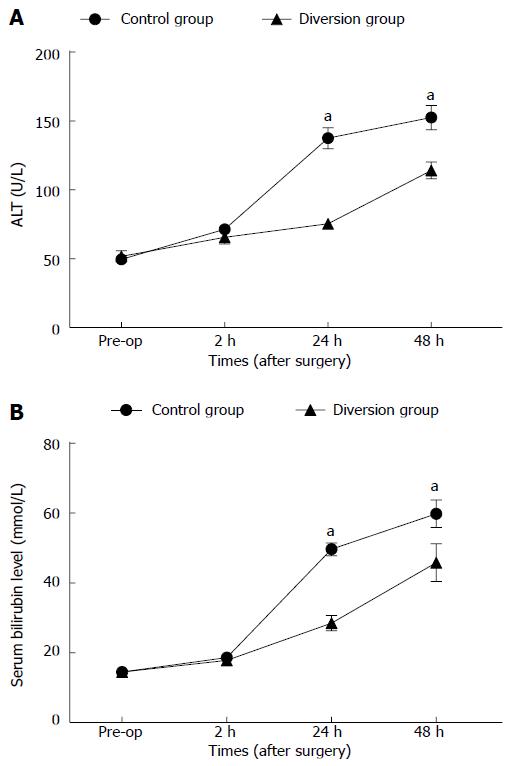
Figure 2 Change in alanine aminotransferase levels and bilirubin levels in the two groups.
aP < 0.05, diversion group vs control group.
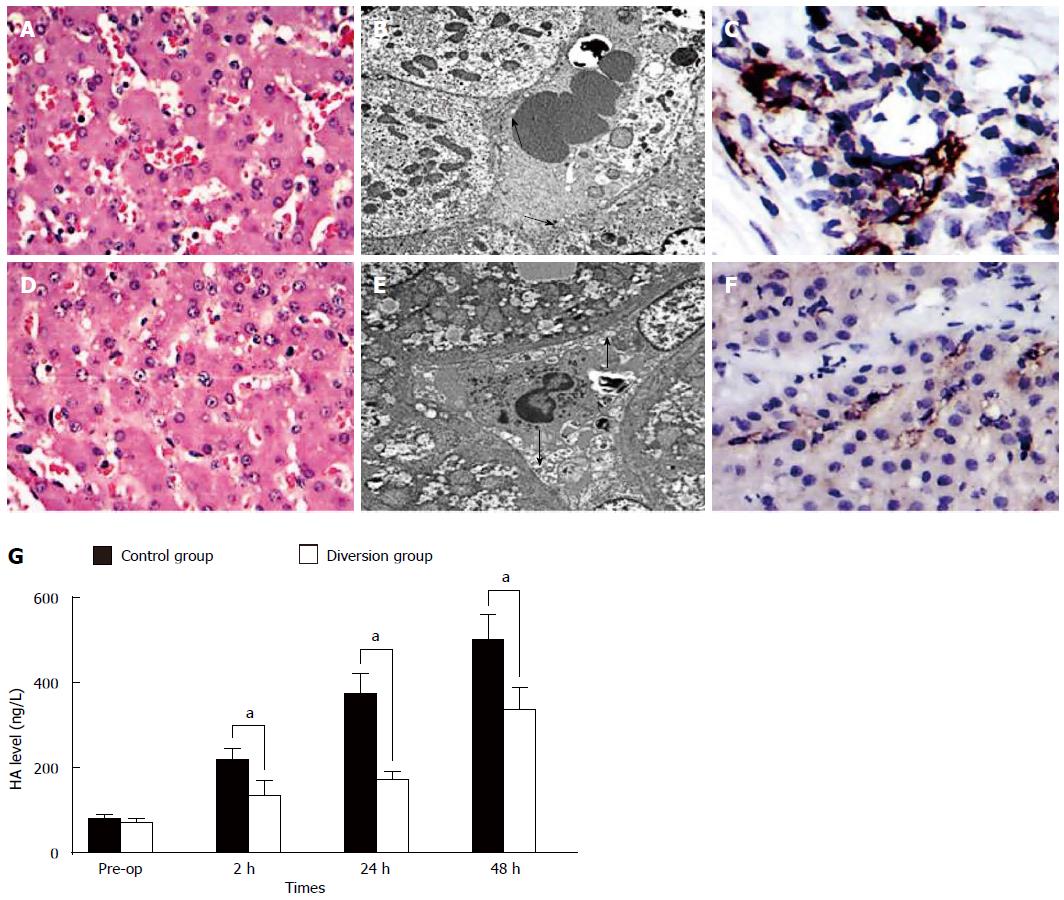
Figure 3 Sinusoidal endothelium.
A, B: HE (magnification × 400); C, D: Transmission electron microscopy photographs (magnification × 6K); E, F: CD31 immunohistochemical staining of tissue samples taken at 1 h post hepatectomy; G: Serial changes in the hyaluronic acid level in the two groups. The arrows and the arrowheads indicate the injuried sinusoidal endothelial cells.
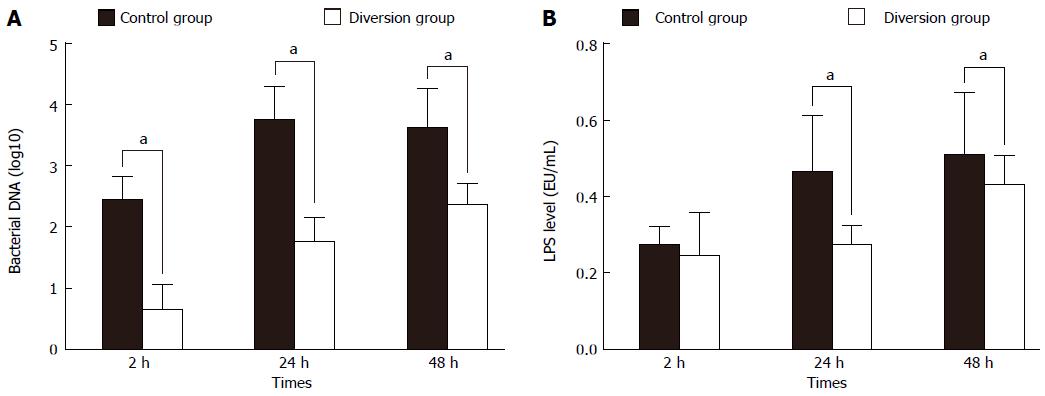
Figure 4 Serial changes in the levels of lipopolysaccharide and bacterial DNA detected in serum in the two groups (A, B).
The serum lipopolysaccharide level in the control group was not significantly different at 2 h post hepatectomy (PH) (P > 0.05), but was significantly higher than that in the diversion group at 24 h and 48 h PH. At all time points, bacterial DNA levels in the control group were significantly elevated compared with the diversion group. aP < 0.05, diversion group vs control group.
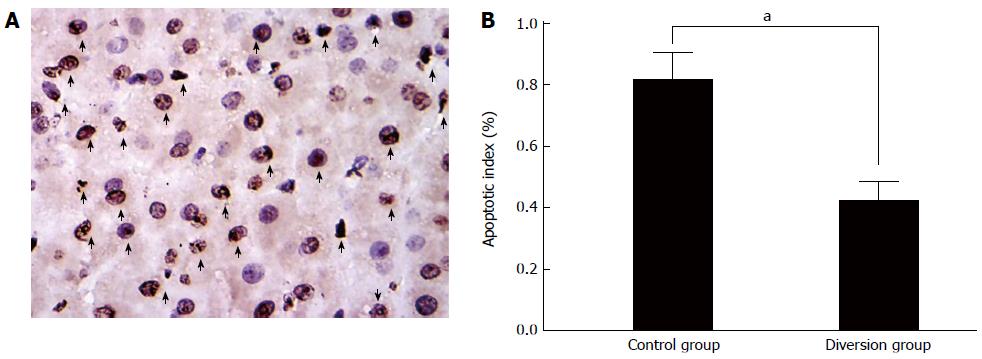
Figure 5 Portal hyperperfusion.
A: Transferase-mediated dUTP-biotin nick end labeling (TUNEL) staining after hepatectomy 48 h post hepatectomy (PH). A large number of TUNEL-positive cells (arrows, identified morphologically by dark brown staining nuclei) are present in the liver remnant; 400 × magnification; B: Microphotometric evaluation of apoptotic index (AI) in TUNEL-stained tissue 48 h PH. Values are expressed as means ± SD; n = 6 in both groups. The differences between the groups are statistically significant. aP < 0.05, diversion group vs control group.
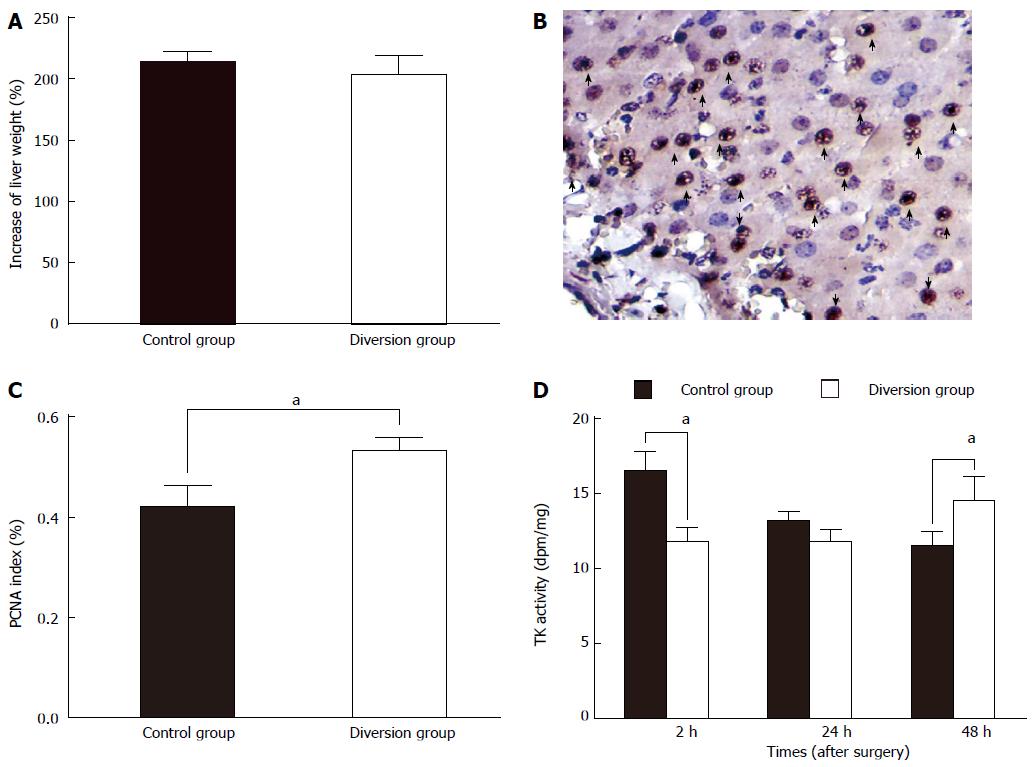
Figure 6 This indicated that the hyperperfusion could be relieved in a short time, which can be attributed to rapid regeneration of the liver remnant after massive hepatectomy.
A: Increase rate of the liver remnant in both groups at 48 h PH (post hepatectomy). There was no significant difference between the control and diversion groups (P = NS); B: Proliferation cell nuclear antigen (PCNA) staining in the liver remnant (positive cells identified by dark-brown-stained nuclei, indicated by arrows; magnification × 400); C: Microphotometric evaluation of PCNA index in PCNA-stained tissue at 48 h PH. Values are expressed as means ± SD for both groups; D: The change in thymidine kinase (TK) activity in both groups. TK activity in the control group was significantly elevated compared with the diversion group at 2 h PH (P = 0.04), but there was no significant difference between the groups at 24 h PH (P = NS). However, TK activity in the control group was significantly reduced compared to that in the diversion group at 48 h PH. aP < 0.05, diversion group vs control group. NS: Not significant.
- Citation: Wang DD, Xu Y, Zhu ZM, Tan XL, Tu YL, Han MM, Tan JW. Should temporary extracorporeal continuous portal diversion replace meso/porta-caval shunts in “small-for-size” syndrome in porcine hepatectomy? World J Gastroenterol 2015; 21(3): 888-896
- URL: https://www.wjgnet.com/1007-9327/full/v21/i3/888.htm
- DOI: https://dx.doi.org/10.3748/wjg.v21.i3.888


