Copyright
©The Author(s) 2015.
World J Gastroenterol. Jan 21, 2015; 21(3): 888-896
Published online Jan 21, 2015. doi: 10.3748/wjg.v21.i3.888
Published online Jan 21, 2015. doi: 10.3748/wjg.v21.i3.888
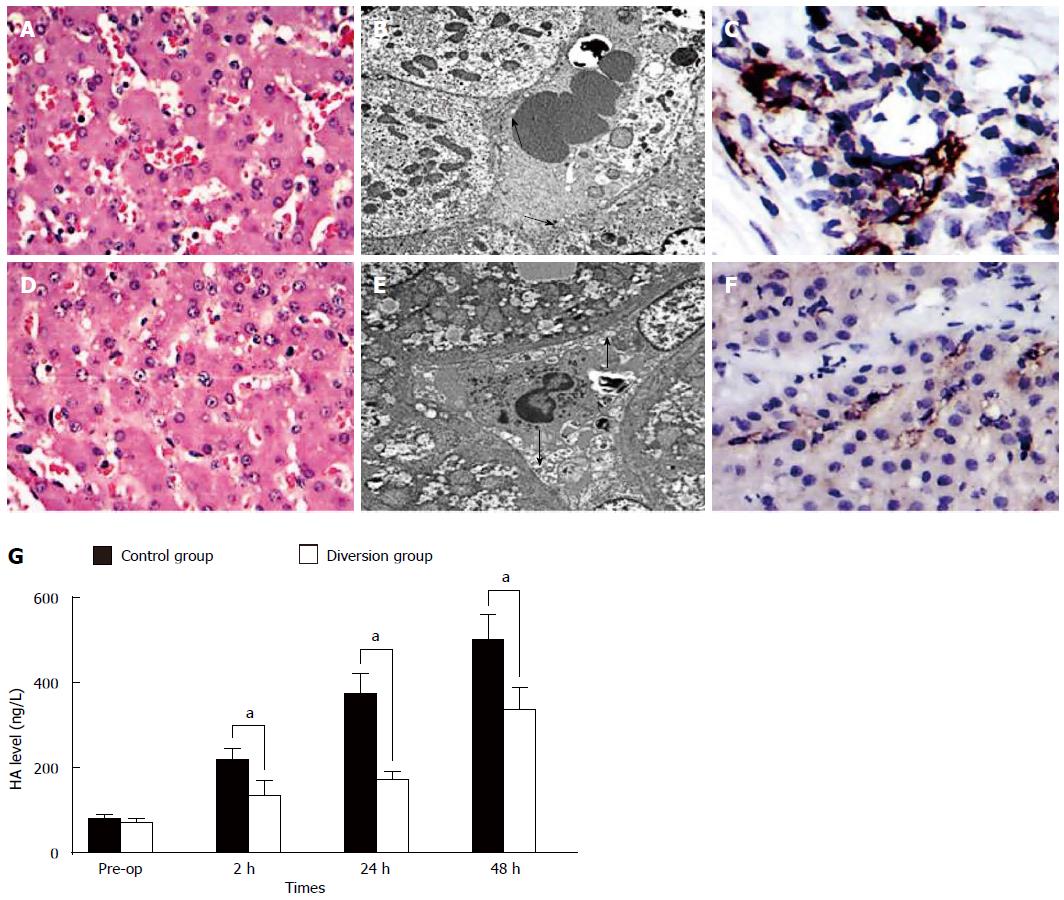
Figure 3 Sinusoidal endothelium.
A, B: HE (magnification × 400); C, D: Transmission electron microscopy photographs (magnification × 6K); E, F: CD31 immunohistochemical staining of tissue samples taken at 1 h post hepatectomy; G: Serial changes in the hyaluronic acid level in the two groups. The arrows and the arrowheads indicate the injuried sinusoidal endothelial cells.
- Citation: Wang DD, Xu Y, Zhu ZM, Tan XL, Tu YL, Han MM, Tan JW. Should temporary extracorporeal continuous portal diversion replace meso/porta-caval shunts in “small-for-size” syndrome in porcine hepatectomy? World J Gastroenterol 2015; 21(3): 888-896
- URL: https://www.wjgnet.com/1007-9327/full/v21/i3/888.htm
- DOI: https://dx.doi.org/10.3748/wjg.v21.i3.888


