Copyright
©The Author(s) 2015.
World J Gastroenterol. Jun 21, 2015; 21(23): 7172-7180
Published online Jun 21, 2015. doi: 10.3748/wjg.v21.i23.7172
Published online Jun 21, 2015. doi: 10.3748/wjg.v21.i23.7172
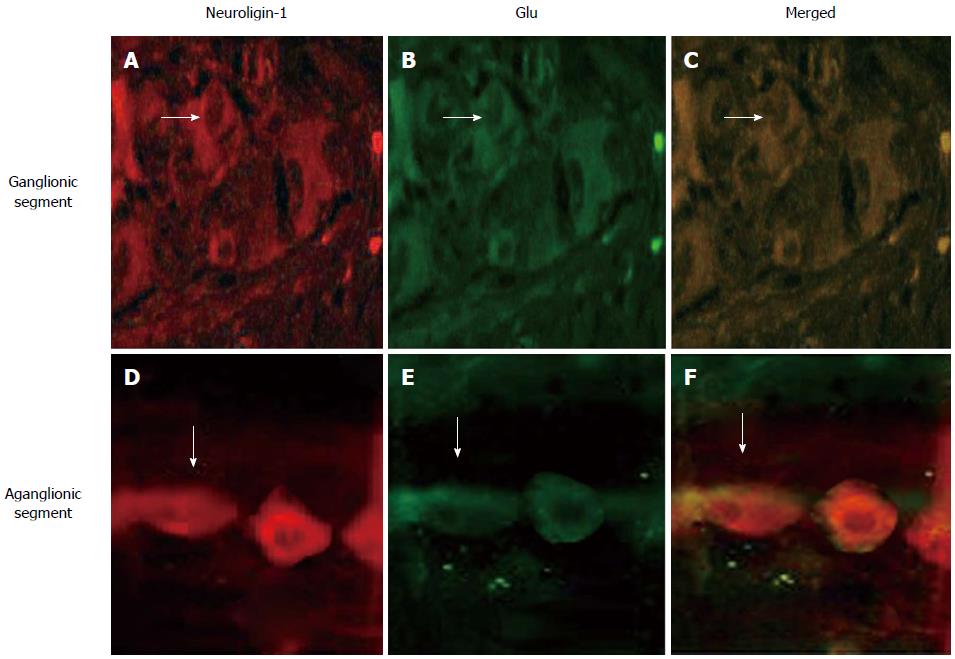
Figure 1 Both in ganglionic segment and aganglionic segment, neuroligin-1 (A, D, red) is expressed in the same position (merged, C, F, yellow) where glutamate is expressed (B, E, green).
The expressed abundance and density were lower in aganglionic segment (D, E, F) than in ganglionic segment (A, B, C). White arrows show ganglion cell with positive stain with a fusiform or triangular shape. Double immunofluorescence staining, magnification × 400. Bars: 50 μm. Glu: Glutamate.
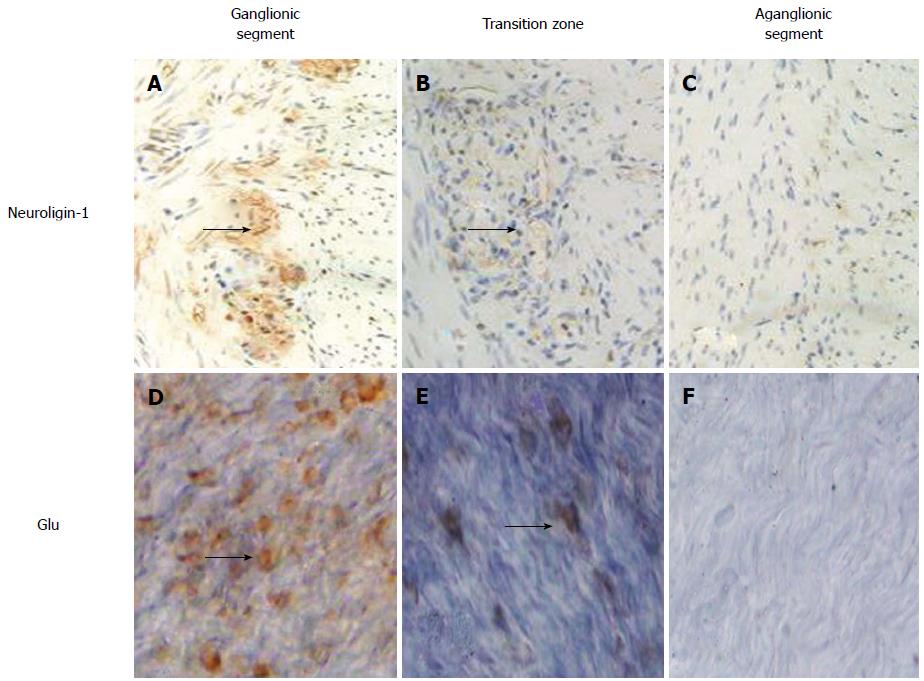
Figure 2 Both the abundance and density of neuroligin-1 on paraffin-embedded sections (A, B, C) and glutamate on longitudinal muscles with adherent myenteric plexus (D, E, F) are highest in ganglionic segment (A, D), moderate in transitional zone (B, E) and lowest in aganglionic segment (C, F).
The black arrows show the positively stained ganglion cells which are expressed between longitudinal muscle and circular muscle both on paraffin-embedded sections (A, B, C) and on longitudinal muscle with adherent myenteric plexus (D, E, F). Immunohistochemical staining, magnification × 400. Bars: 50 μm. Glu: Glutamate.
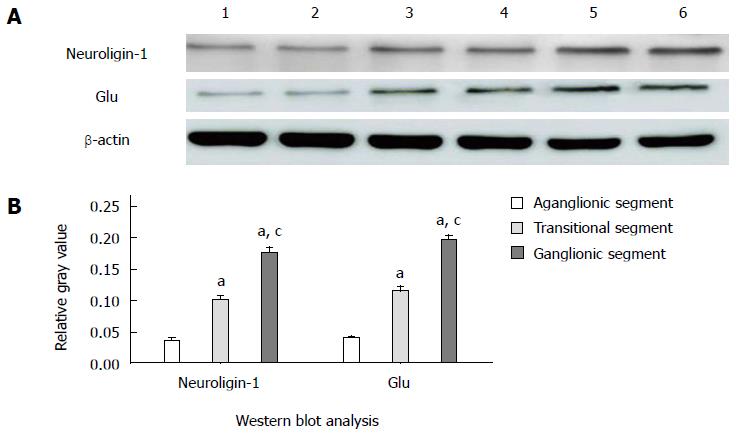
Figure 3 Western blot analysis (A, B) show that neuroligin-1 and glutamate are both expressed significantly in ganglionic segments (n = 90), moderately in transitional segments (n = 90) and obviously weakly in aganglionic segments (n = 90).
Data are expressed as mean ± SD. aP < 0.05 vs aganglionic segments; cP < 0.05 vs transitional segments.
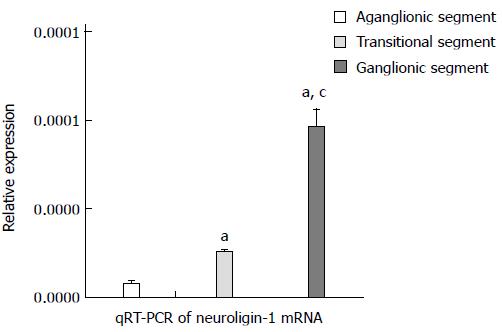
Figure 4 Quantitative real-time PCR shows that neuroligin-1 mRNA is expressed significantly in ganglionic segments (n = 90), moderately in transitional segments (n = 90) and obviously downed-regulated in aganglionic segments (n = 90).
Data are expressed as mean ± SD. aP < 0.05 vs aganglionic segments; cP < 0.05 vs transitional segments.
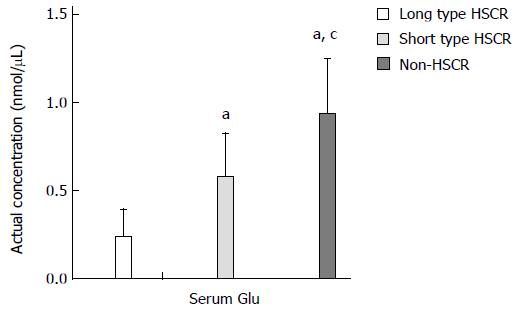
Figure 5 Enzyme-linked immunosorbent assay shows the concentration of serum glutamate is lowest in long type Hirschsprung’s disease (n = 40), moderate in short type Hirschsprung’s disease (n = 50) and highest in non-Hirschsprung’s disease (n = 50).
Data are expressed as mean ± SD. aP < 0.05 vs long type HSCR; cP < 0.05 vs short type HSCR. HSCR: Hirschsprung’s disease; Glu: Glutamate.
- Citation: Wang J, Du H, Mou YR, Niu JY, Zhang WT, Yang HC, Li AW. Abundance and significance of neuroligin-1 and glutamate in Hirschsprung’s disease. World J Gastroenterol 2015; 21(23): 7172-7180
- URL: https://www.wjgnet.com/1007-9327/full/v21/i23/7172.htm
- DOI: https://dx.doi.org/10.3748/wjg.v21.i23.7172


