Copyright
©The Author(s) 2015.
World J Gastroenterol. May 28, 2015; 21(20): 6215-6228
Published online May 28, 2015. doi: 10.3748/wjg.v21.i20.6215
Published online May 28, 2015. doi: 10.3748/wjg.v21.i20.6215
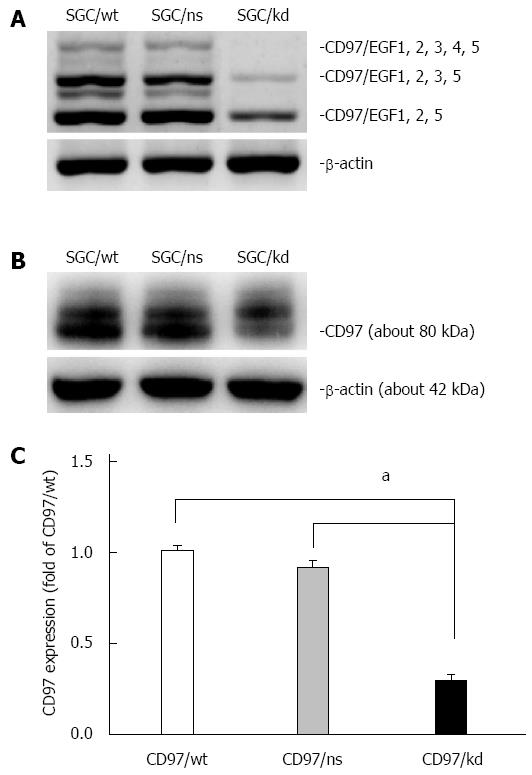
Figure 1 Identification of transfectants with stable CD97 knockdown.
A: RT-PCR analysis was used to assess CD97 mRNA levels of SGC/wt, SGC/ns and SGC/kd. This result showed a decreased CD97 level in SGC/kd compared to SGC/wt and SGC/ns; B: The -80 kDa CD97 protein was detected by western blot analysis in total cellular extracts of SGC/wt, SGC/ns and SGC/kd; C: Western blot analysis showed a significant decrease in CD97 protein in SGC/kd. Data are expressed as mean ± SD. aP < 0.05 vs SGC/wt or SGC/ns. SGC/wt: Wild-type gastric cancer cells SGC-7901; SGC/ns: Non-silencing vector bearing cells; SGC/kd: Stable CD97 knockdown cells generated from SGC-7901.
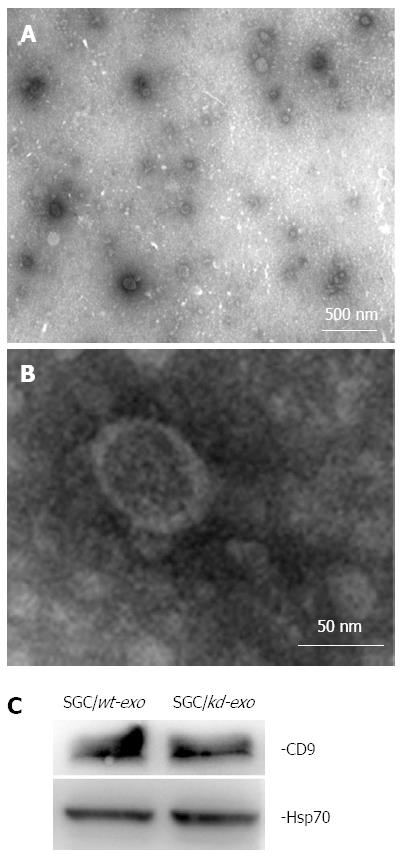
Figure 2 Characterization of tumor-derived exosomes by electron microscopy and western blot analysis.
A and B: Exosomes released by SGC/wt or SGC/kd cells were isolated and observed with an electron microscope. The exosomes are small round vesicles limited by a lipid bilayer, and their diameters are between 30 and 100 nm. Scale bars are as indicated; C: Western blot analysis of exosomal lysate proteins. The published exosomal markers, Hsp70 and CD9, were detected in exosomes derived from gastric cancer cells, indicating successful exosome isolation. SGC/wt-exo: Exosomes isolated from SGC/wt cells; SGC/kd-exo: Exosomes isolated from SGC/kd cells.
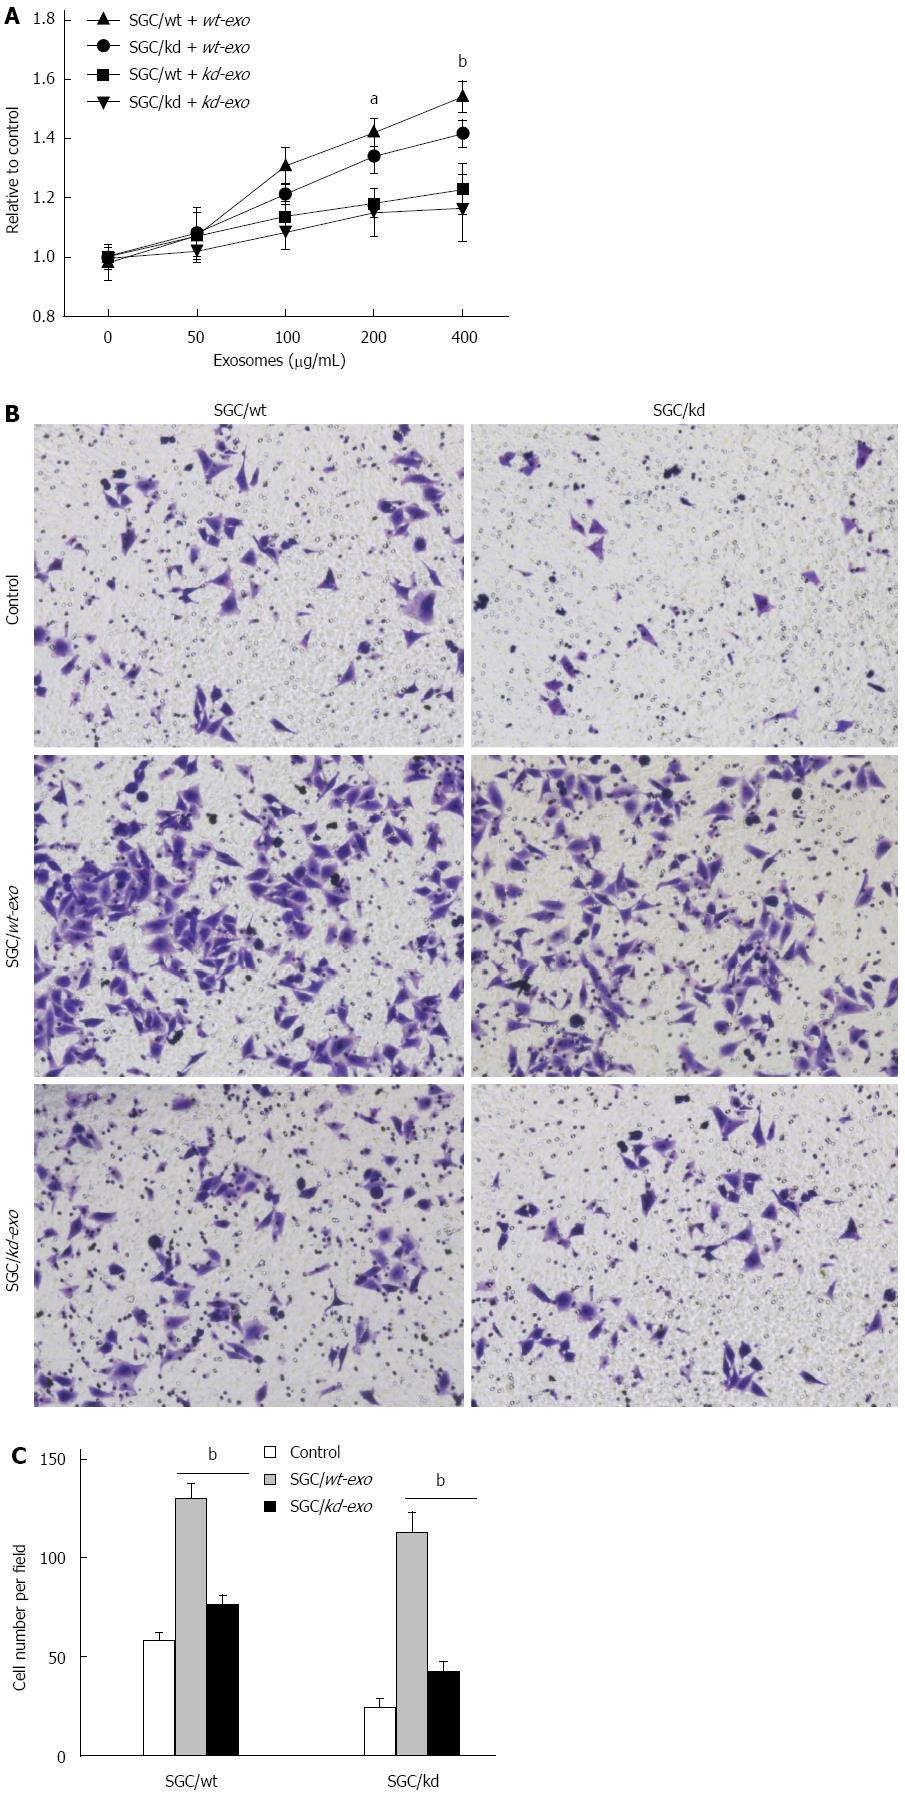
Figure 3 SGC/wt cells-derived exosomes promoted tumor cell proliferation and invasion in vitro.
A: A total of 5 × 10³/well SGC/wt and SGC/kd cells were seeded in 96-well plates in RPMI 1640 medium without fetal bovine serum (FBS). After incubating overnight, the cells were treated with wt-exo or kd-exo at the concentrations of 0, 50, 100, 200 and 400 μg/mL for 24 h, and cell proliferation was measured by MTS assay. The results showed that wt-exo significantly promoted proliferation of both SGC/wt and SGC/kd cells in a dose-dependent manner. aP < 0.05, bP < 0.01 vs kd-exo group; B: SGC/wt and SGC/kd cells were treated with 200 μg/mL of indicated exosomes for 4 h, and seeded on Matrigel matrix coated chambers for the invasion assay; C: Invaded cell counting revealed that the number of penetrated cells in the wt-exo group was significantly higher than that in the kd-exo group. bP < 0.01 vs kd-exo group. Representative crystal violet staining after 36 h invasion showed invaded cells in each group. Data are expressed as mean ± SD. wt-exo: SGC/wt-derived exosomes; kd-exo: SGC/kd-derived exosomes.
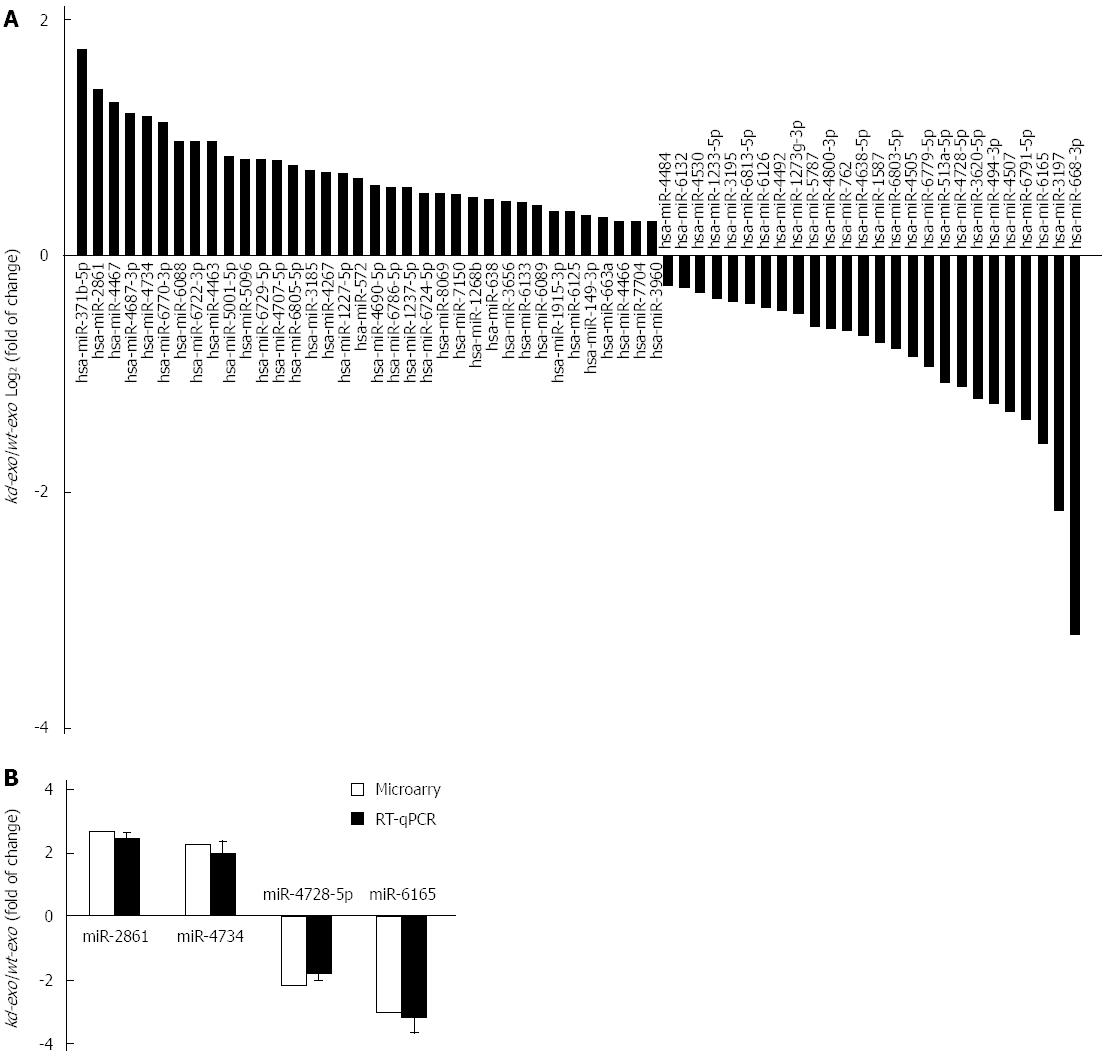
Figure 4 Comparison of miRNA profiles of the two exosomes by microarray analysis and validation of differently expressed miRNAs by RT-qPCR analysis.
A: Bar graph showed differently expressed miRNAs in kd-exo by microarray as compared to wt-exo; B: Four miRNAs that displayed either an increased or decreased expression were selected for RT-qPCR validation of microarray assay. The same expression trends were observed between microarray and RT-qPCR for all the miRNAs. wt-exo: SGC/wt-derived exosomes; kd-exo: SGC/kd-derived exosomes.
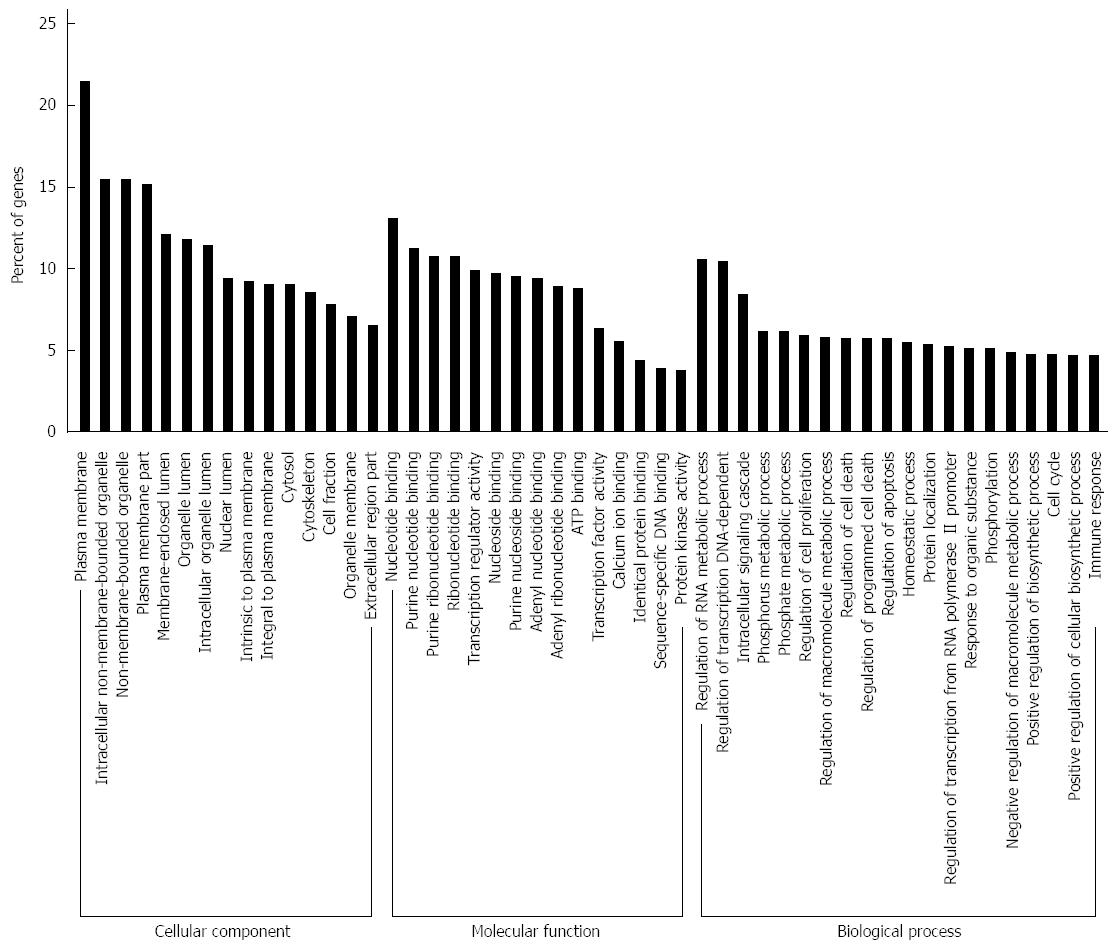
Figure 5 Gene ontology analysis of the significant predicted genes of differently expressed miRNAs.
The results were classified into three main categories: cellular component, molecular function, and biological process. The vertical axis indicated the percent of genes in each category. The horizontal axis is the enrichment of Gene ontology (GO).
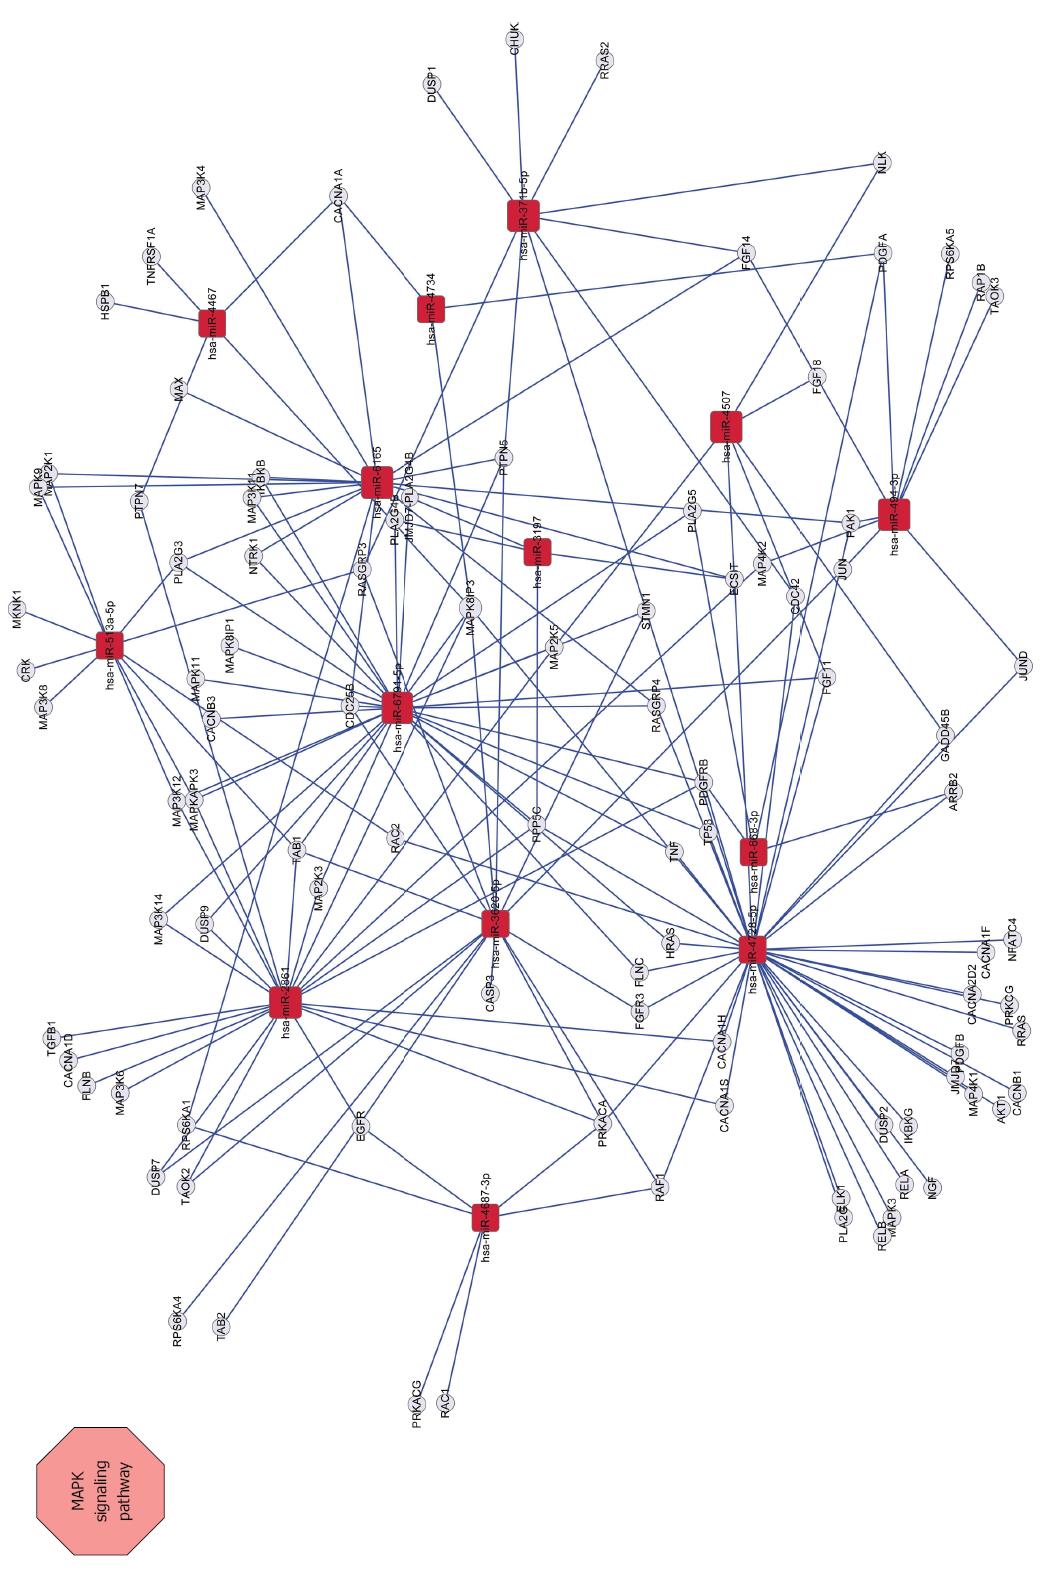
Figure 6 Network between MAPK signaling pathway-related genes and miRNAs.
Squares represent miRNAs; circles represent target genes; straight lines represent miRNA-MAPK signaling pathway-related gene relationship. The size of the square represents the degree of miRNAs, a larger degree has a larger number of target genes.
- Citation: Li C, Liu DR, Li GG, Wang HH, Li XW, Zhang W, Wu YL, Chen L. CD97 promotes gastric cancer cell proliferation and invasion through exosome-mediated MAPK signaling pathway. World J Gastroenterol 2015; 21(20): 6215-6228
- URL: https://www.wjgnet.com/1007-9327/full/v21/i20/6215.htm
- DOI: https://dx.doi.org/10.3748/wjg.v21.i20.6215


