
















©The Author(s) 2015.
World J Gastroenterol. May 28, 2015; 21(20): 6215-6228
Published online May 28, 2015. doi: 10.3748/wjg.v21.i20.6215
Published online May 28, 2015. doi: 10.3748/wjg.v21.i20.6215
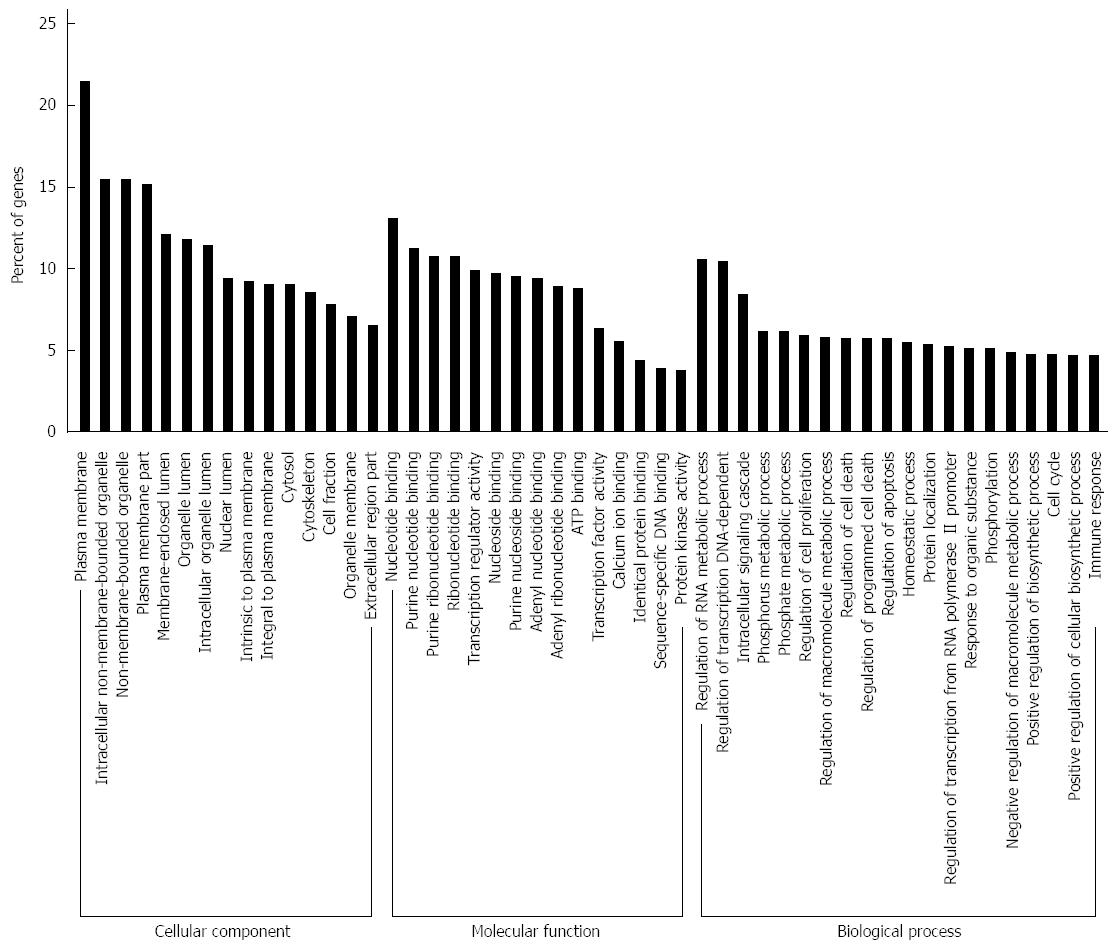
Figure 5 Gene ontology analysis of the significant predicted genes of differently expressed miRNAs.
The results were classified into three main categories: cellular component, molecular function, and biological process. The vertical axis indicated the percent of genes in each category. The horizontal axis is the enrichment of Gene ontology (GO).
- Citation: Li C, Liu DR, Li GG, Wang HH, Li XW, Zhang W, Wu YL, Chen L. CD97 promotes gastric cancer cell proliferation and invasion through exosome-mediated MAPK signaling pathway. World J Gastroenterol 2015; 21(20): 6215-6228
- URL: https://www.wjgnet.com/1007-9327/full/v21/i20/6215.htm
- DOI: https://dx.doi.org/10.3748/wjg.v21.i20.6215