Copyright
©The Author(s) 2015.
World J Gastroenterol. Apr 28, 2015; 21(16): 4975-4985
Published online Apr 28, 2015. doi: 10.3748/wjg.v21.i16.4975
Published online Apr 28, 2015. doi: 10.3748/wjg.v21.i16.4975
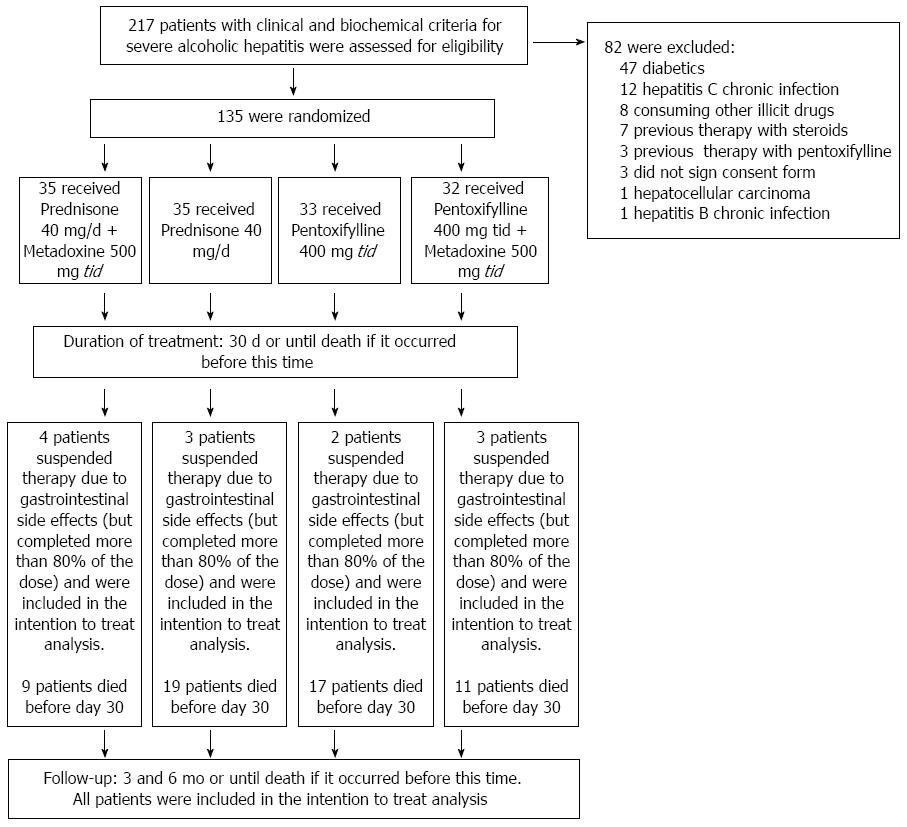
Figure 1 Enrollment and outcomes.
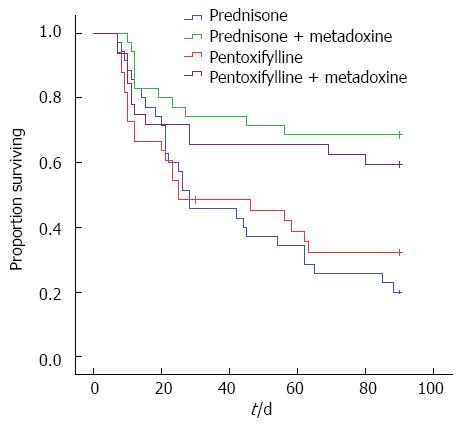
Figure 2 Kaplan Meier curves showing the 3-mo survival according to the treatment groups.
Pentoxifylline + Metadoxine 59.4% vs Pentoxifylline 33.3%, Log rank test P = 0.04; Prednisone + Metadoxine 68.6% vs Prednisone 20%, Log rank test P = 0.0001.
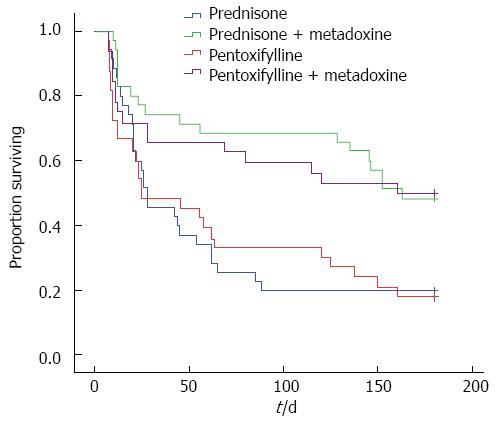
Figure 3 Kaplan Meier curves showing the 6-mo survival according to the treatment groups.
Pentoxifyne + Metadoxine 50% vs Pentoxifylline 18.2%, Log rank test P = 0.01; Prednisone + Metadoxine 48.6% vs Prednisone 20%, Log rank test P = 0.003.
- Citation: Tijera FHDL, Servín-Caamaño AI, Serralde-Zúñiga AE, Cruz-Herrera J, Pérez-Torres E, Abdo-Francis JM, Salas-Gordillo F, Pérez-Hernández JL. Metadoxine improves the three- and six-month survival rates in patients with severe alcoholic hepatitis. World J Gastroenterol 2015; 21(16): 4975-4985
- URL: https://www.wjgnet.com/1007-9327/full/v21/i16/4975.htm
- DOI: https://dx.doi.org/10.3748/wjg.v21.i16.4975


