Copyright
©The Author(s) 2015.
World J Gastroenterol. Apr 28, 2015; 21(16): 4894-4902
Published online Apr 28, 2015. doi: 10.3748/wjg.v21.i16.4894
Published online Apr 28, 2015. doi: 10.3748/wjg.v21.i16.4894
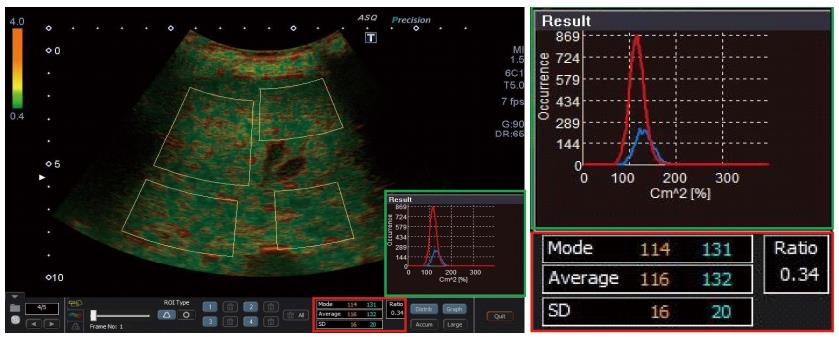
Figure 1 Acoustic structure quantification analysis of liver tissue.
Four separate regions of interest were drawn to cover most of the parenchyma, but avoiding large vessels. The acoustic structure quantification software automatically calculated the parameters mode, average and standard deviation for both curves of the histogram (green frame), as well as the ratio of the areas under both curves (focal disturbance ratio, red frame).
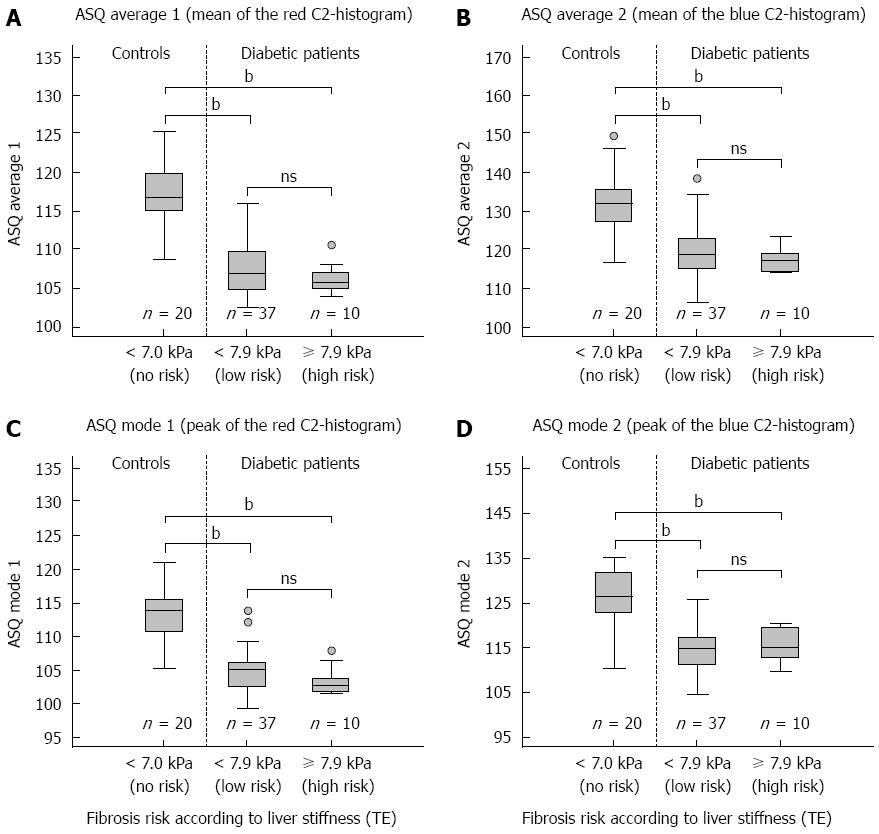
Figure 2 Correlation of acoustic structure quantification parameters with liver stiffness.
Acoustic structure quantification (ASQ) parameters mode and the average of the "red" (A, C) and "blue" C2-histogram (B, D) show no significant differences between diabetic patients with and without increased liver stiffness (transient elastography, TE). The differences of all parameters between both patient groups and healthy controls (bP < 0.01 vs control, Mann-Whitney U test) suggest an influence of diabetes-related anthropometric and metabolic factors, e.g., steatosis, on ASQ analysis.
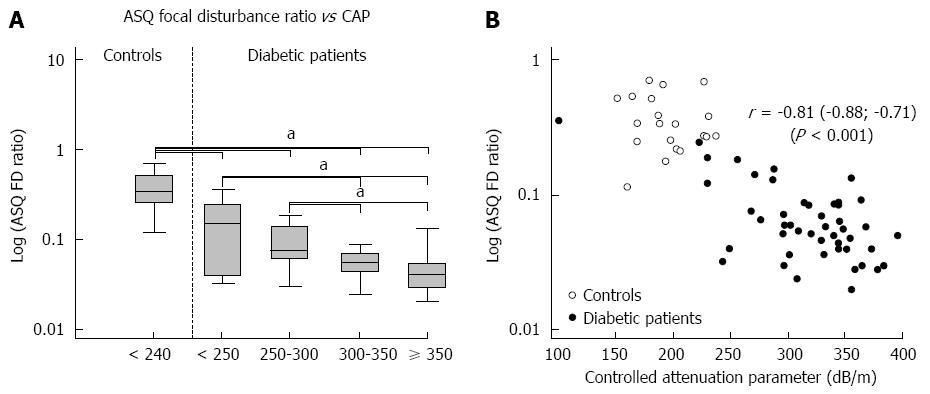
Figure 3 Correlation of acoustic structure quantification focal disturbance ratio and controlled attenuation parameter values in healthy controls and diabetic patients.
Acoustic structure quantification (ASQ) focal disturbance (FD) ratio decreased in patients with advanced steatosis compared with healthy controls and patients with mild steatosis (aP < 0.05, vs control, Kruskal-Wallis test) (A). Logarithmic ASQ values correlated strongly with controlled attenuation parameter (CAP) values (B).
- Citation: Karlas T, Berger J, Garnov N, Lindner F, Busse H, Linder N, Schaudinn A, Relke B, Chakaroun R, Tröltzsch M, Wiegand J, Keim V. Estimating steatosis and fibrosis: Comparison of acoustic structure quantification with established techniques. World J Gastroenterol 2015; 21(16): 4894-4902
- URL: https://www.wjgnet.com/1007-9327/full/v21/i16/4894.htm
- DOI: https://dx.doi.org/10.3748/wjg.v21.i16.4894


