Copyright
©The Author(s) 2015.
World J Gastroenterol. Apr 28, 2015; 21(16): 4894-4902
Published online Apr 28, 2015. doi: 10.3748/wjg.v21.i16.4894
Published online Apr 28, 2015. doi: 10.3748/wjg.v21.i16.4894
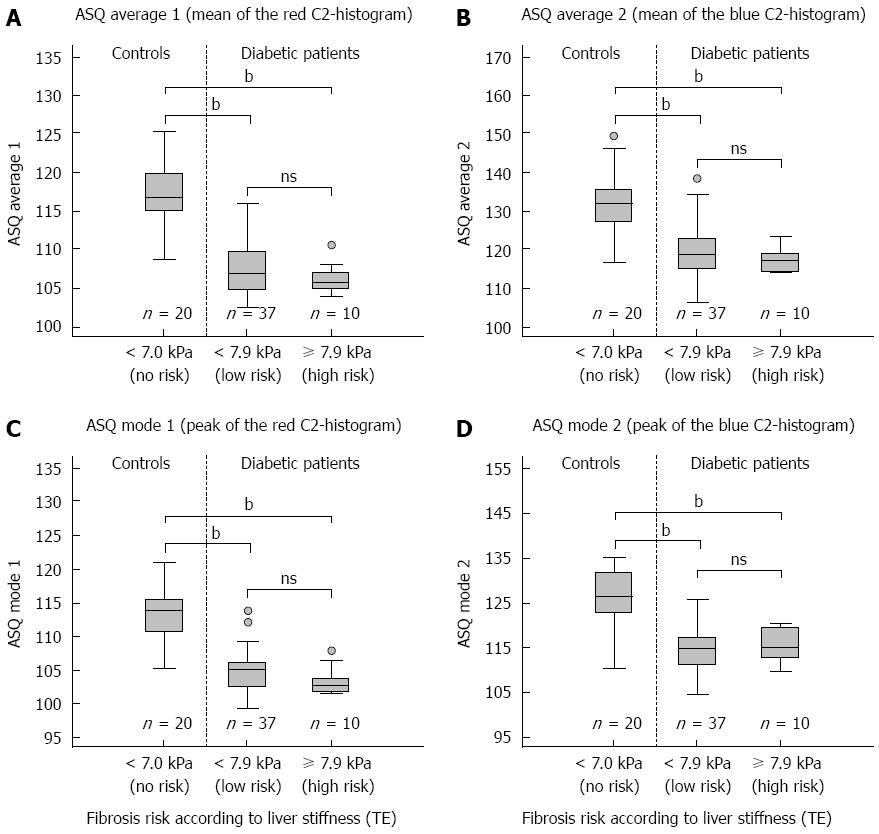
Figure 2 Correlation of acoustic structure quantification parameters with liver stiffness.
Acoustic structure quantification (ASQ) parameters mode and the average of the "red" (A, C) and "blue" C2-histogram (B, D) show no significant differences between diabetic patients with and without increased liver stiffness (transient elastography, TE). The differences of all parameters between both patient groups and healthy controls (bP < 0.01 vs control, Mann-Whitney U test) suggest an influence of diabetes-related anthropometric and metabolic factors, e.g., steatosis, on ASQ analysis.
- Citation: Karlas T, Berger J, Garnov N, Lindner F, Busse H, Linder N, Schaudinn A, Relke B, Chakaroun R, Tröltzsch M, Wiegand J, Keim V. Estimating steatosis and fibrosis: Comparison of acoustic structure quantification with established techniques. World J Gastroenterol 2015; 21(16): 4894-4902
- URL: https://www.wjgnet.com/1007-9327/full/v21/i16/4894.htm
- DOI: https://dx.doi.org/10.3748/wjg.v21.i16.4894


