Copyright
©The Author(s) 2015.
World J Gastroenterol. Apr 28, 2015; 21(16): 4883-4893
Published online Apr 28, 2015. doi: 10.3748/wjg.v21.i16.4883
Published online Apr 28, 2015. doi: 10.3748/wjg.v21.i16.4883
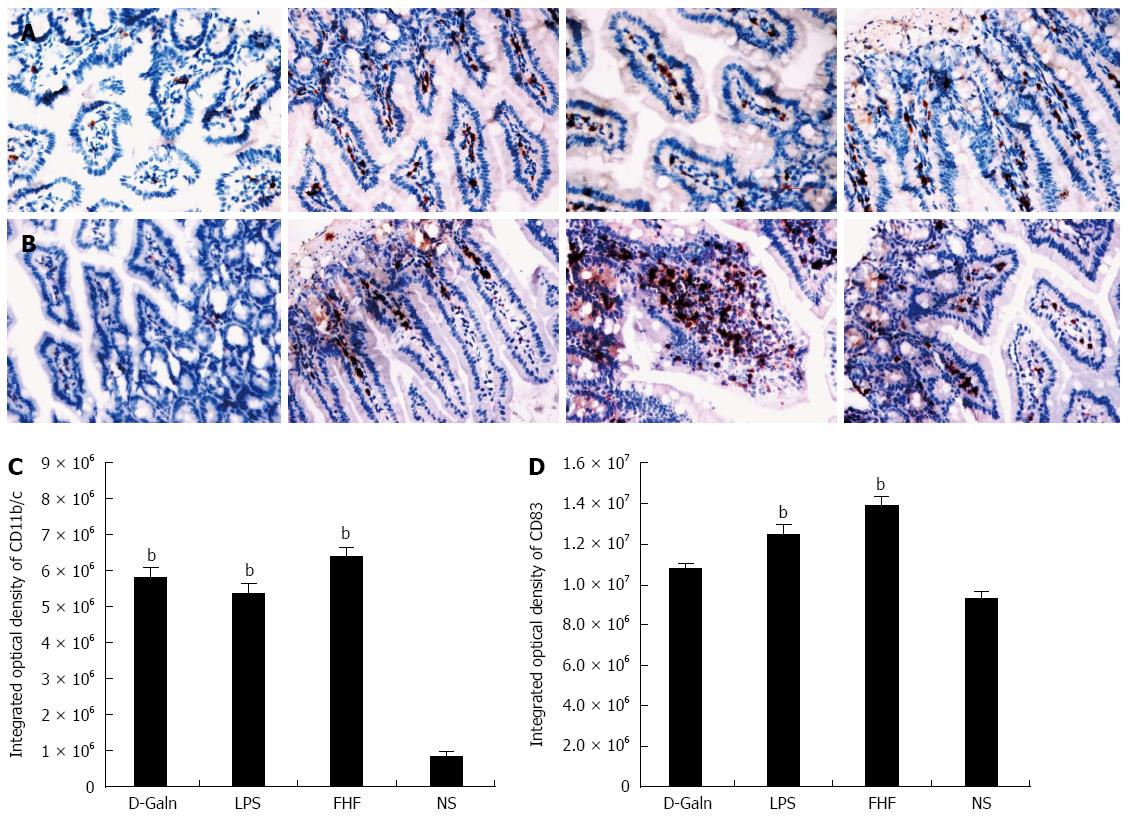
Figure 1 Immunohistochemical staining of CD11b/c (A) and CD83 (B) and integrated optical density of CD11b/c (C) and CD83 (D).
From left to right panel: Normal saline (NS) group, D-galactosamine (D-Galn) group, lipopolysaccharide (LPS) group, and fulminant hepatic failure (FHF) group (A and B). The integrated optical density of CD11b/c (C) and CD83 (D) in the FHF group was notably increased compared with those of the NS group, but there was no significant difference compared with the LPS and D-Galn groups. The integrated optical density of CD11b/c in the LPS and D-Galn groups, as well as CD83 in the LPS group, was notably increased compared with that of the NS group (bP < 0.001 vs the NS group, one way ANOVA with Dunnett test, n≥ 15).
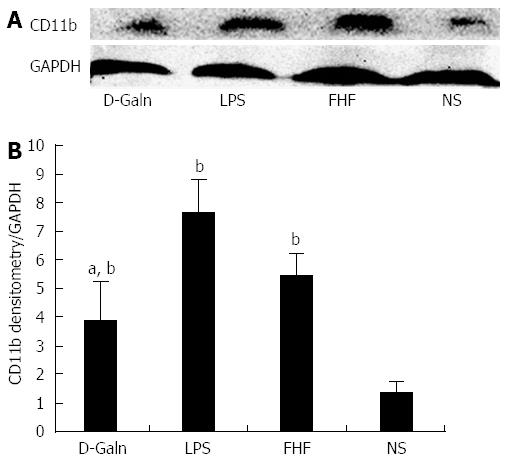
Figure 2 Intestinal CD11b protein expression.
A: CD11b protein was detected by Western blot; B: Densitometric analysis using Image-Pro software. The absorbance value of CD11b/absorbance value of GAPDH in the fulminant hepatic failure (FHF) was notably increased compared with those of the normal saline (NS) and D-galactosamine (D-Galn) groups, but there was no significant change compared with that of the lipopolysaccharide (LPS) group (bP < 0.001 vs the NS group, aP < 0.05 vs the D-Galn group, one-way ANOVA with Dunnett test; n≥ 15).
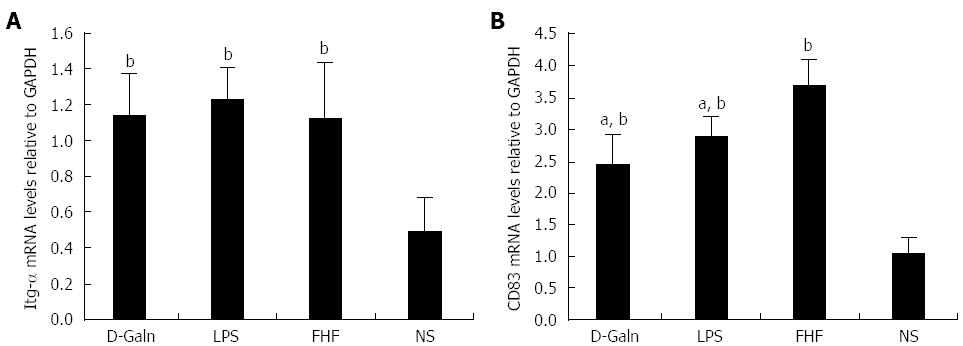
Figure 3 Relative expression of intestinal integrin-α (A) and CD83 (B) mRNAs.
The relative levels of intestinal integrin-α (Itg-α) mRNA in the fulminant hepatic failure (FHF) group were significantly increased compared to the normal saline (NS) group, but there was no significant difference compared with those of the lipopolysaccharide (LPS) and D-galactosamine (D-Galn) groups. The relative levels of intestinal CD83 mRNA in the FHF group were significantly increased compared with the NS group, LPS group and D-Galn group (bP < 0.001 vs the NS group, aP < 0.05 vs the LPS and D-Galn groups, one-way ANOVA with Dunnett test; n≥ 15).
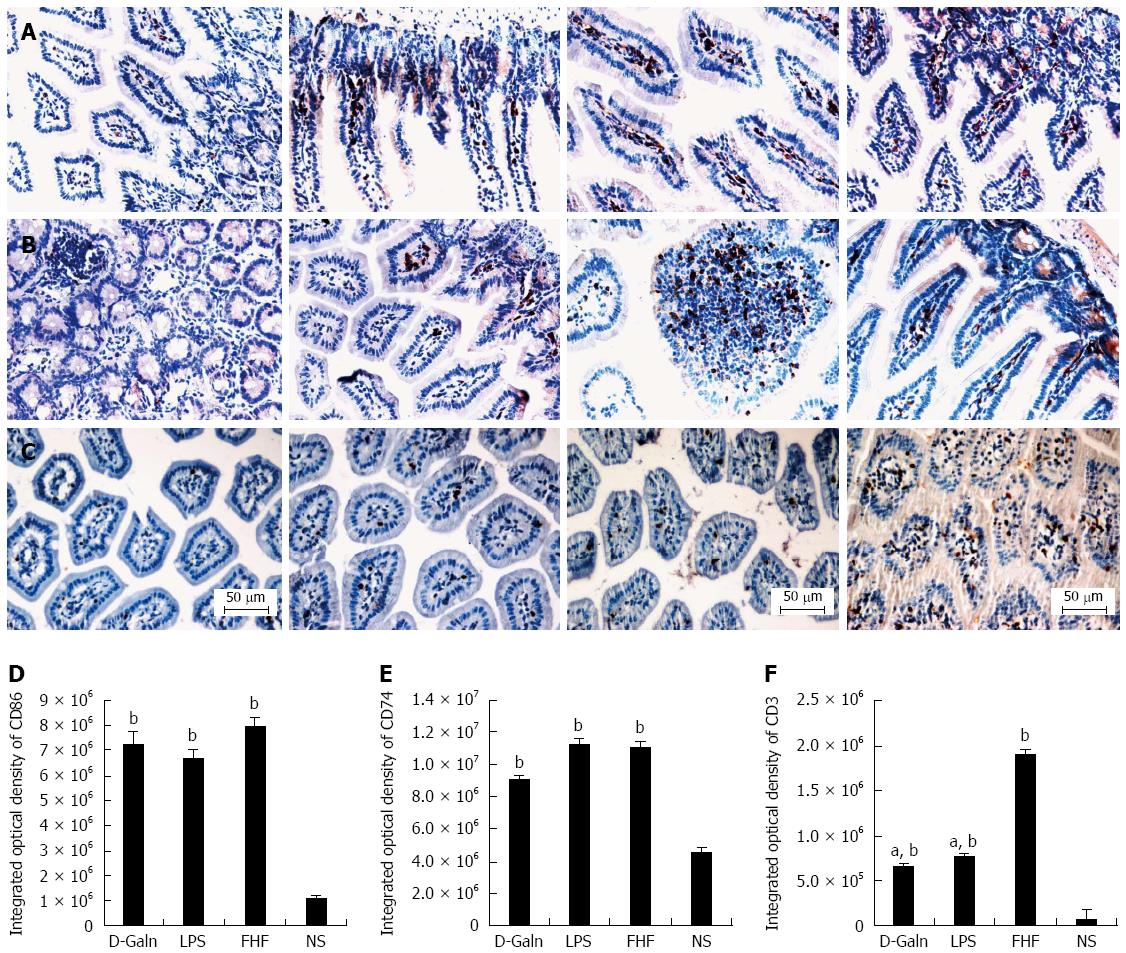
Figure 4 Immunohistochemical staining of CD86 (A), CD74 (B), and CD3(C) and integrated optical density of CD86 (D) CD74 (E), and CD3 (F).
From left to right panel: Normal saline (NS) group, D-galactosamine (D-Galn) group, lipopolysaccharide (LPS) group, and fulminant hepatic failure (FHF) group (A, B and C). The integrated optical density of CD86 (D) and CD74 (E) in the FHF group was notably increased compared to the NS group. However, CD86 and CD74 were not significantly different among the FHF, LPS and D-Galn groups. The integrated optical density of CD3 in the FHF group was notably increased compared with the NS, LPS and D-Galn groups (bP < 0.001 vs the NS group, aP < 0.05 vs LPS and D-Galn groups, one-way ANOVA with Dunnett test; n≥ 15).
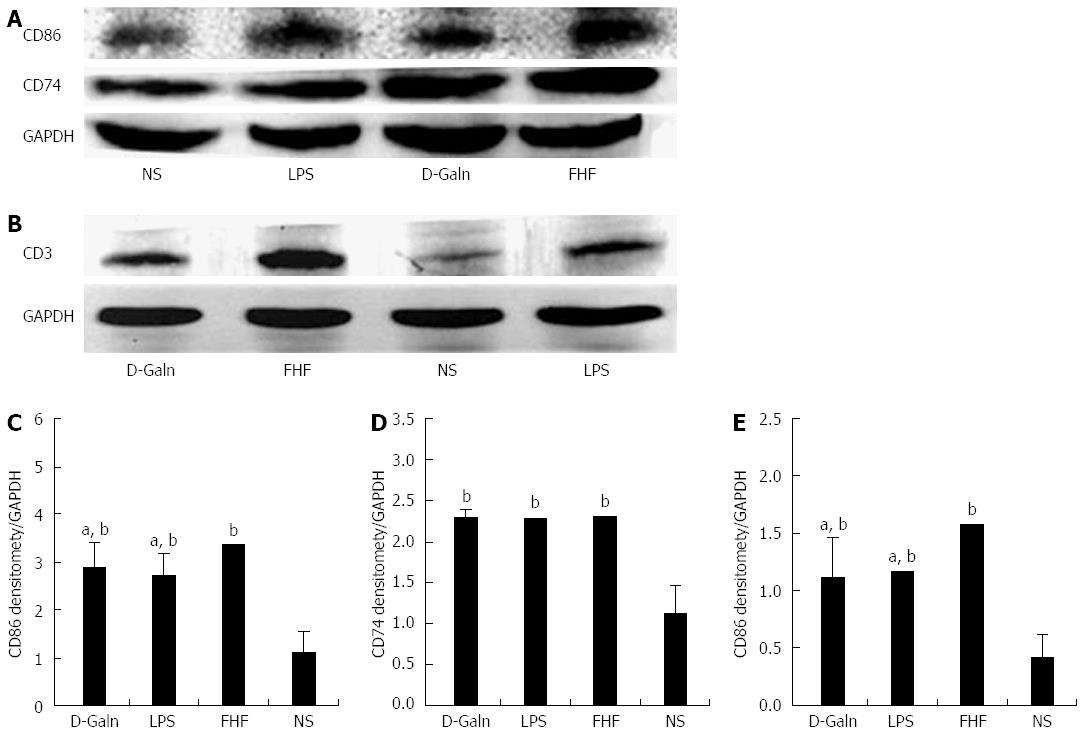
Figure 5 Intestinal CD86 (A), CD74 (B), and CD3 (C) protein expression.
A and B: CD86, CD74, and CD3 protein expression was detected by Western blot; C, D and E: Densitometric analysis using Image-Pro software. The absorbance values for CD86 and CD74 and the CD3/absorbance value of GAPDH in tissues from the fulminant hepatic failure (FHF) group were notably increased compared with those of the normal saline (NS) group. The CD86 and CD3 levels were increased, but for CD74 there were no significant differences compared with the lipopolysaccharide (LPS) and D-galactosamine (D-Galn) groups (bP < 0.001 vs the NS group, aP < 0.05 vs the LPS and D-Galn groups, one-way ANOVA with Dunnett test; n≥ 15).
Figure 6 Relative levels of intestinal CD86 (A), CD74 (B), and CD3 (C) mRNAs.
Levels of intestinal CD86, CD74 and CD3 mRNAs in tissues from the fulminant hepatic failure (FHF) group were significantly increased compared with those of the normal saline (NS) group, but there were no significant differences compared with tissues from the lipopolysaccharide (LPS) and D-galactosamine (D-Galn) groups (bP < 0.001 vs the NS group, one-way ANOVA with Dunnett test; n≥ 15).
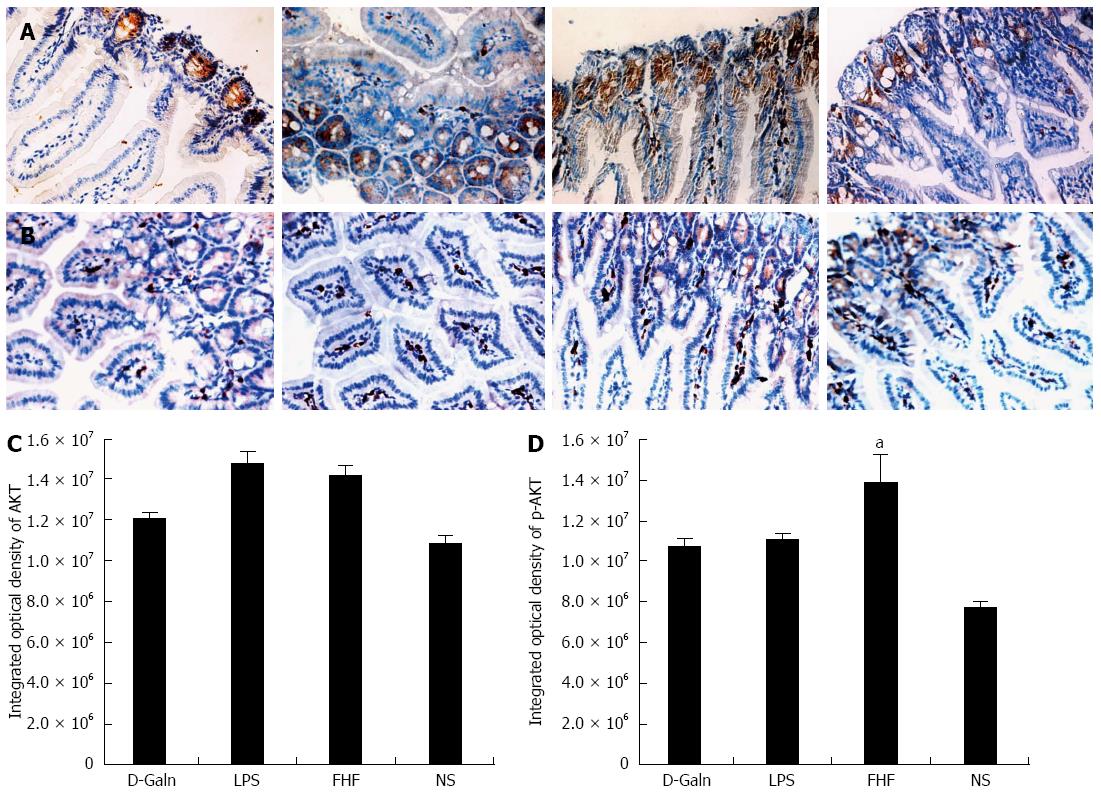
Figure 7 Immunohistochemistry staining of AKT (A) and phosphorylated-AKT (B) and integrated optical density of AKT (C) and phosphorylated-AKT (D).
From left to right panel: Normal saline (NS) group, D-galactosamine (D-Galn) group, lipopolysaccharide (LPS) group, and fulminant hepatic failure (FHF) group (A and B). The integrated optical density of AKT (C) in the FHF group was not significantly different compared to the NS group, LPS group and D-Galn group The integrated optical density of phosphorylated-AKT (p-AKT) (D) in the FHF was notably increased compared with the NS group but not significantly different compared with the LPS and D-Galn groups (aP < 0.05 vs the NS group, one-way ANOVA Dunnett test; n≥ 15).
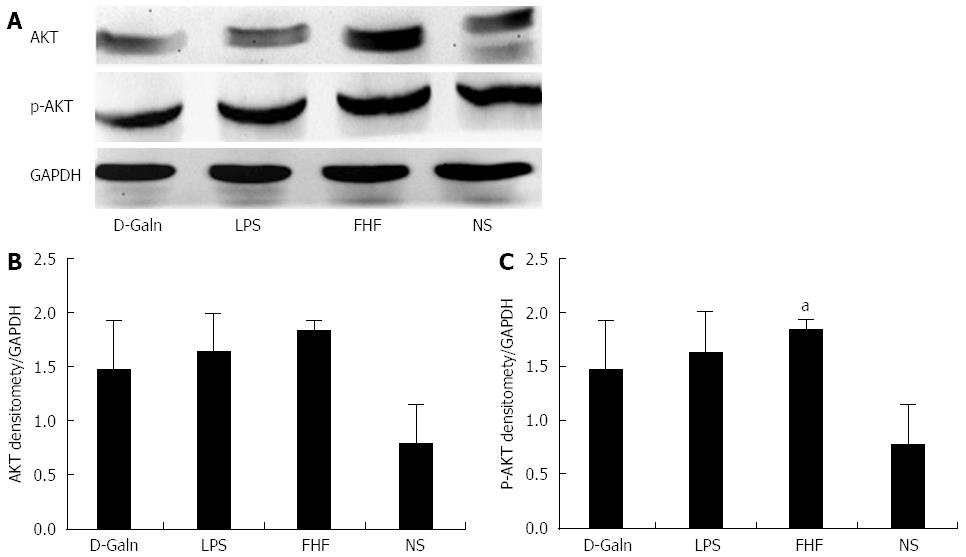
Figure 8 Intestinal AKT and phosphorylated-AKT protein expression.
A: AKT and p-AKT protein expression was detected by Western blot; B and C: Densitometric analysis using the Image-Pro software. The ratio of the absorbance of AKT/absorbance of GAPDH in the fulminant hepatic failure (FHF) group was not significantly different compared with those of normal saline (NS), lipopolysaccharide (LPS) and D-galactosamine (D-Galn) groups. The ratio of the absorbance of phosphorylated-AKT (p-AKT)/absorbance of GAPDH in the FHF group was notably increased compared with that of NS group, but was not significantly different compared with those of the LPS and D-Galn groups (aP < 0.05 vs the NS group, one-way ANOVA with Dunnett test; n≥ 15).
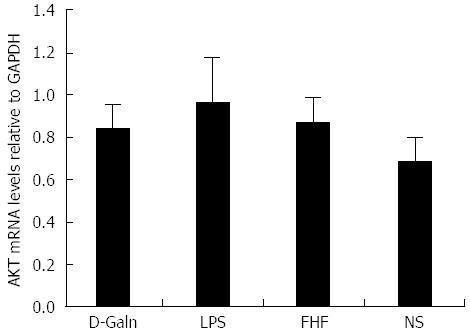
Figure 9 Relative levels of intestinal AKT mRNA.
The relative levels of intestinal AKT mRNA among the four groups were not significantly different (P > 0.05, one-way ANOVA with Dunnett test; n≥ 15). D-Galn: D-galactosamine; FHF: Fulminant hepatic failure; LPS: Lipopolysaccharide; NS: Normal saline.
- Citation: Cao X, Liu M, Wang P, Liu DY. Intestinal dendritic cells change in number in fulminant hepatic failure. World J Gastroenterol 2015; 21(16): 4883-4893
- URL: https://www.wjgnet.com/1007-9327/full/v21/i16/4883.htm
- DOI: https://dx.doi.org/10.3748/wjg.v21.i16.4883


