Copyright
©The Author(s) 2015.
World J Gastroenterol. Apr 14, 2015; 21(14): 4210-4215
Published online Apr 14, 2015. doi: 10.3748/wjg.v21.i14.4210
Published online Apr 14, 2015. doi: 10.3748/wjg.v21.i14.4210
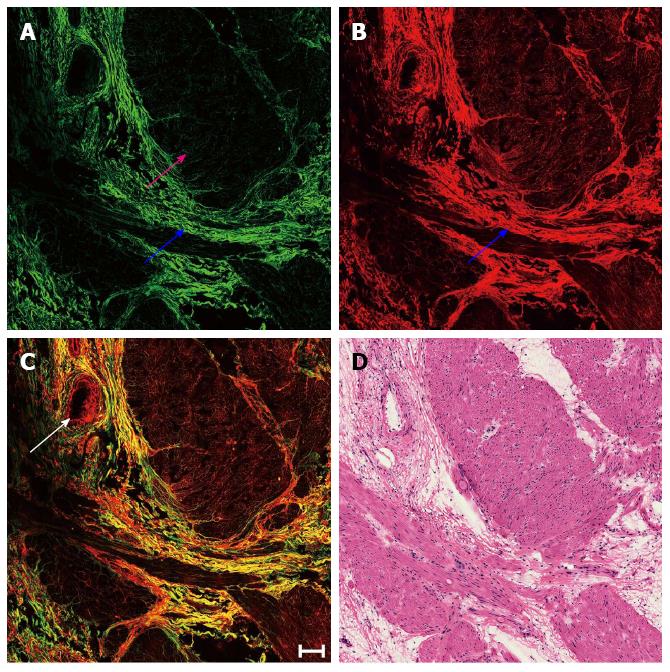
Figure 1 Representative multiphoton microscopy images from a muscularis propria specimen, color-coded green represents the second-harmonic generation signal and color-coded red corresponds to the two-photon excited fluorescence signal.
After neoadjuvant radiochemotherapy, predominant fibrosis changes can be seen with minimal inflammatory cells replacing tumor cells. A: Multiphoton microscopy of second-harmonic generation from collagen; B: Two-photon excited fluorescence of collagen, elastin, inflammatory cells, and blood vessels; C: Overlay image (scale bar: 100 μm); D: Hematoxylin and eosin staining of an adjacent section (magnification × 40). The tumor underwent complete regression and was replaced by fibrous tissues (blue arrows). Blood vessel hyperplasia is denoted with a white arrow. Muscular tissue is denoted with a pink arrow.
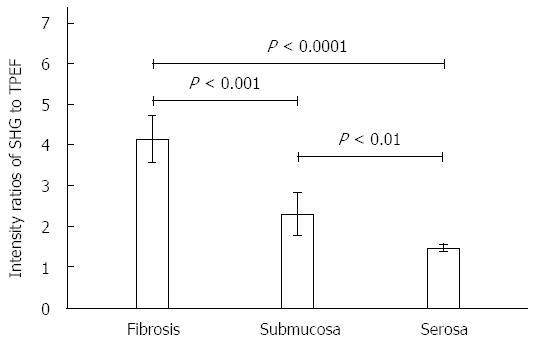
Figure 2 Ratios of second-harmonic generation and two-photon excited fluorescence intensity.
Error bars indicate the standard deviation. SHG: Second-harmonic generation; TPEF: Two-photon excited fluorescence.
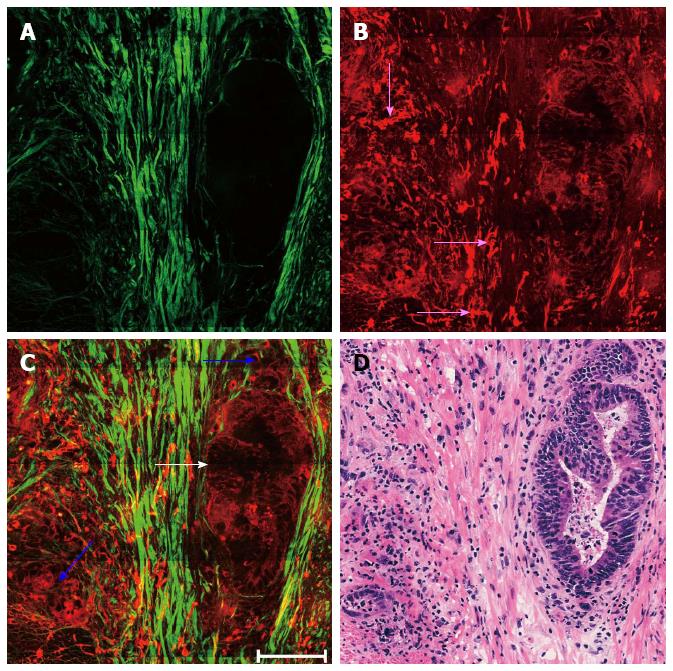
Figure 3 Representative multiphoton microscopy images from a muscularis propria specimen after neoadjuvant radiochemotherapy, color-coded green represents the second-harmonic generation signal and color-coded red corresponds to the two-photon excited fluorescence signal.
Remaining malignant glands are dispersed deep within the rectal muscularis propria. A: Multiphoton microscopy of second-harmonic generation from collagen; B: Two-photon excited fluorescence of carcinomatous cells, inflammatory cells, and elastin; C: Overlay image (scale bar: 100 μm); D: Hematoxylin and eosin staining of an adjacent section (magnification × 40). Tumor cells in post-treatment rectal carcinoma show marked changes, and can become more solid (blue arrows) or retain a glandular growth pattern (white arrow). Fragmented elastic fibers are denoted by pink arrows.
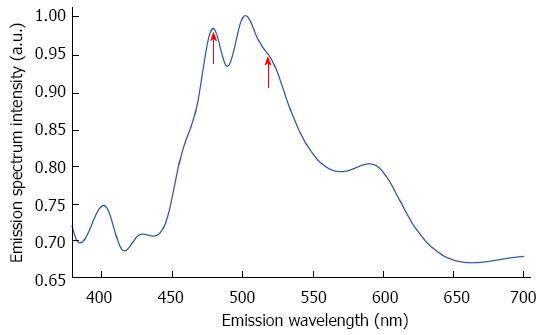
Figure 4 Normalized emission spectrum of residual tumor cells.
Excitation wavelength (810 nm) revealed two emission peaks (red arrows).
- Citation: Li LH, Chen ZF, Wang XF, Zhuo SM, Li HS, Jiang WZ, Guan GX, Chen JX. Multiphoton microscopy for tumor regression grading after neoadjuvant treatment for colorectal carcinoma. World J Gastroenterol 2015; 21(14): 4210-4215
- URL: https://www.wjgnet.com/1007-9327/full/v21/i14/4210.htm
- DOI: https://dx.doi.org/10.3748/wjg.v21.i14.4210


